Agentic AI for Saudi Hotels (2026): What Can It Automate?
Discover what agentic AI can automate in Saudi hotels in 2026, from WhatsApp bookings and dynamic pricing to housekeeping, ZATCA invoicing and reports....
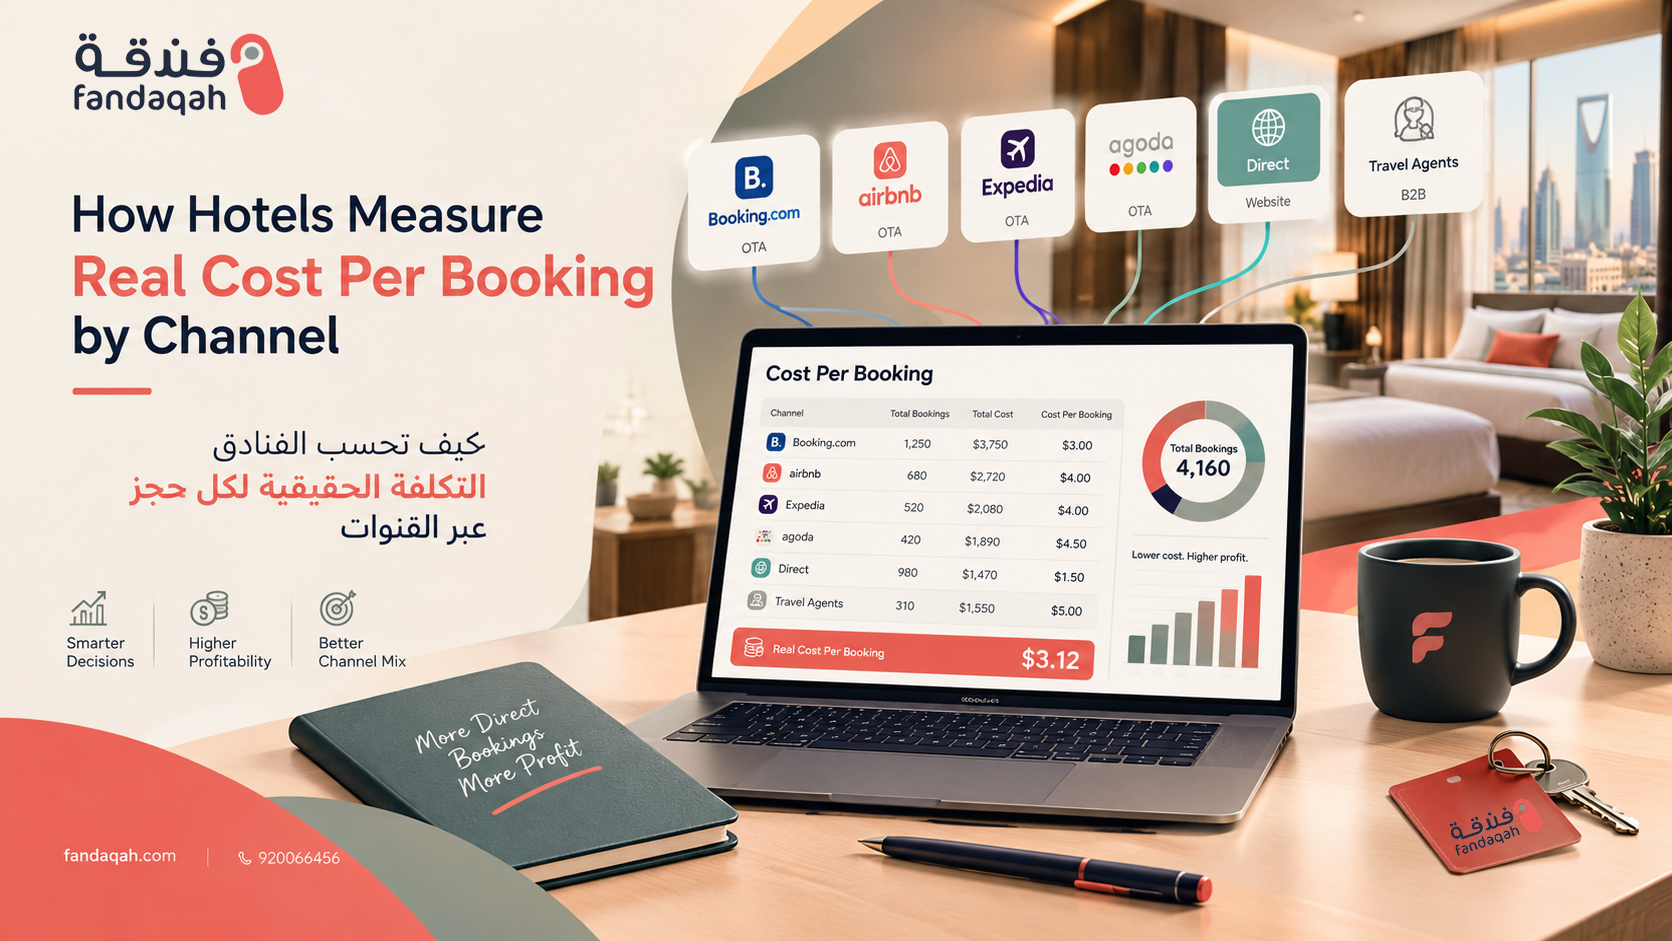
Hotel Distribution & Revenue Management Guide
A practical, step-by-step framework for Saudi hotels to calculate true hotel cost per booking, compare OTA, direct, GDS, wholesale and metasearch channels, and protect profit as the Kingdom's tourism market grows.
Most hotels know their OTA commission rate by heart. Ask a general manager in Riyadh or Jeddah what Booking.com or Expedia costs, and you will hear a number between 15% and 25% almost instantly. But ask what a direct booking really costs after paid ads, booking engine fees, payment charges, loyalty discounts and staff time, and the room usually goes quiet.
That silence is expensive. Without a clear view of your real hotel cost per booking, you cannot tell which channel truly makes money, which one only looks cheap, and where your next riyal of marketing budget should go. Commission is only one line in a much longer bill. Payment fees, technology subscriptions, cancellations, rate discounts, sales salaries and advertising all belong in the calculation too.
This guide shows you exactly how to calculate cost per booking for hotels across every distribution channel. You will get a simple formula, a full worked example for a 200-room hotel in Riyadh, a channel comparison, Saudi-specific use cases for Makkah, Madinah, Jeddah, AlUla and the Red Sea, and a look at how Vision 2030 is changing hotel distribution costs in the Kingdom.
⚡ Quick Answer: What Is a Hotel's Real Cost Per Booking?
A hotel's real cost per booking is the total cost of acquiring and servicing reservations from one channel (commissions, marketing, payment fees, technology, labour, discounts and cancellation losses) divided by the number of stayed bookings from that channel in the same period.
Formula: Real Cost Per Booking = Total Channel Costs ÷ Stayed (Net) Bookings
???? Key Takeaways
In hotel distribution, cost per booking (CPB) measures how much money you spend to win and fulfil one reservation from a specific channel. It is closely related to customer acquisition cost (CAC) and to cost of acquisition as a percentage of revenue, which many revenue managers call "distribution cost %".
The word "real" matters. A commission-only view counts what an OTA invoices you. A real cost view counts everything the booking consumed: the ad click that brought the guest, the payment processor that charged the card, the channel manager that pushed the rate, the reservations agent who answered the WhatsApp message, and the discount you gave to win the sale.
A commission rate is a percentage of revenue charged by one partner. Cost per booking is an amount in riyals that includes all partners and all internal effort. Two channels can have the same commission rate and very different real costs. For example, an OTA booking paid by virtual card may carry an extra card processing fee, while a corporate booking through a travel management company may add GDS transaction fees and a share of your sales team's salary.
Many hotels divide channel costs by the number of reservations received. This is a mistake. Fixed costs such as ad spend, channel subscriptions and staff time are consumed by every reservation, including those that later cancel. If you divide by gross reservations, channels with high cancellation rates look far cheaper than they really are. Always use net bookings that actually stayed (or were charged as no-shows).
???? Note: Three Metrics, One Decision
Track Cost Per Booking (SAR per stay), Cost of Acquisition % (costs ÷ room revenue) and Net Revenue Per Room Night (revenue minus costs, ÷ nights). CPB tells you efficiency, cost % tells you margin impact, and net revenue per night tells you which channel actually pays the best.
Before you can measure your total cost of distribution, you need a complete list of what to measure. These are the cost buckets that most often go missing from hotel channel reports:
| Channel | Visible Costs | Hidden Costs | Where to Find the Data |
|---|---|---|---|
| OTAs (Booking.com, Expedia, Agoda, Almosafer) | Commission, visibility boosts | VCC fees, high cancellations, parity monitoring | OTA extranet invoices, PMS, channel manager |
| Direct website | Booking engine fee, ad spend | Payment fees, loyalty discounts, SEO and content costs | GA4, ad platforms, booking engine reports, finance ledger |
| Metasearch (Google Hotel Ads, Trivago) | Cost per click or commission | Booking engine and payment fees on converted clicks | Metasearch dashboards, booking engine |
| GDS / Corporate / TMC | GDS fees, TMC commission | Sales team salaries, RFP programme fees | GDS/CRS statements, payroll allocation |
| Wholesale / Bedbanks / Umrah operators | Discounted net rate | Rate leakage, contracting time, remittance fees | Contracts, accounts receivable, rate shopper |
| Voice / WhatsApp / Walk-in | Agent salaries | WhatsApp Business API, phone system, payment fees | PMS source codes, payroll, telecom bills |
Here is a repeatable method any hotel, from a 40-key boutique property in AlUla to a 600-room tower near the Haram, can follow every month.
List each source separately. Do not group "OTAs" into one line. Booking.com, Expedia, Agoda and Almosafer often have different commission structures, cancellation behaviour and guest profiles. Split direct into website, metasearch, voice, WhatsApp and walk-in. Clean, consistent source and channel codes in your PMS are the foundation of everything else.
Use a monthly period, measured by stay date rather than booking date, so costs match the revenue they produced. Convert all costs to SAR, including ad spend billed in US dollars.
Pull stayed bookings, room nights and room revenue from the PMS. Pull commissions from OTA invoices, ad spend from Google and Meta, payment fees from your acquirer statement, and technology and payroll costs from finance. Your own data is your strongest evidence, and no industry benchmark replaces it.
Some costs serve several channels. A channel manager supports all OTAs and wholesalers. A reservations team supports voice, WhatsApp and email. Allocate these by share of bookings, share of room nights or share of time spent. Pick one method and use it consistently so month-to-month trends stay honest.
???? The Real Cost Per Booking Formulas
To show the method in action, here is one month of data for a fictional upscale 200-room business hotel in Riyadh. The figures are illustrative and built to reflect common channel patterns. Replace them with your own numbers to get your real answer.
| Channel | Stayed Bookings | Revenue (SAR) | Total Costs (SAR) | Cost Per Booking | Cost % | Net Rev / Night |
|---|---|---|---|---|---|---|
| OTAs (ADR 650, LOS 2.0) | 900 | 1,170,000 | 248,850 | SAR 277 | 21.3% | SAR 512 |
| Direct website (ADR 620, LOS 2.4) | 400 | 595,200 | 73,712 | SAR 184 | 12.4% | SAR 543 |
| Metasearch → direct (ADR 640, LOS 2.2) | 150 | 211,200 | 28,560 | SAR 190 | 13.5% | SAR 553 |
| Wholesale / bedbanks (net ADR 520, LOS 3.0) | 300 | 468,000 | 13,680 | SAR 46 | 2.9% | SAR 505 |
| GDS / Corporate TMC (ADR 700, LOS 1.8) | 250 | 315,000 | 59,450 | SAR 238 | 18.9% | SAR 568 |
| Voice / WhatsApp / Walk-in (ADR 660, LOS 2.0) | 200 | 264,000 | 29,780 | SAR 149 | 11.3% | SAR 586 |
| Hotel total (blended) | 2,200 | 3,023,400 | 454,032 | SAR 206 | 15.0% | — |
How costs were built: OTAs = 18% commission + 2.5% VCC fees + SAR 9,000 shared tech and labour. Direct = 3% booking engine + 2% payment fees + SAR 30,000 paid ads + 1% loyalty + SAR 8,000 website and SEO. Metasearch = SAR 18,000 CPC + 3% booking engine + 2% payments. Wholesale = 1% remittance + SAR 9,000 contracting and trade marketing. GDS/TMC = SAR 45 GDS fee per booking + 8% TMC commission + SAR 23,000 sales team and programme fees. Voice = SAR 22,000 agents + SAR 2,500 telecom + 2% payments.
"The cheapest booking is not the one with the lowest commission. It is the one that leaves the most net revenue per room night after every cost has been counted."Core revenue management principle
In our example, OTAs generated 1,285 reservations, but 385 cancelled (about 30%). If you divide SAR 248,850 by 1,285 gross reservations, the OTA cost per booking drops to roughly SAR 194. That makes the channel look about 30% cheaper than it really is. Dividing by the 900 stayed bookings reveals the true figure of SAR 277. In markets with flexible cancellation policies, such as leisure demand during Riyadh Season, this gap can be even wider.
???? Pro Tip: Add Guest Lifetime Value
A direct guest who returns three times a year costs you acquisition money only once. Tag repeat guests by their original channel and review cost per booking alongside 12-month guest value. A channel with a higher first-booking cost can still win if it brings loyal, repeat guests.
Once your hotel measures real cost per booking by channel, decisions that used to rely on instinct become clear and defensible.
The Saudi hospitality market has distribution patterns that differ from Europe or the US. The scenarios below are illustrative and show how the framework adapts to each segment.
Hotels near the Haram often rely heavily on Umrah operators, wholesale allotments and group contracts, especially around Ramadan. Cost per booking may look very low, but net revenue per night can fall far below what OTA or direct guests pay in peak weeks. Measuring net revenue per night by season helps these hotels decide how many rooms to commit to allotments and how many to hold back for higher-yield channels, including platforms such as Nusuk that serve pilgrims directly.
Riyadh hotels balance corporate RFP business, government delegations, conferences and leisure spikes during Riyadh Season. Corporate channels carry sales team and GDS costs, while event weeks trigger heavy paid advertising. Tracking cost per booking weekly during major events shows whether campaign spend actually beat what OTAs would have delivered anyway.
Resorts along the Red Sea coast attract domestic families and growing international leisure demand. Longer stays reduce acquisition cost per room night, so these properties should compare channels on cost per room night as well as cost per booking. Direct packages with transfers and dining can raise total revenue per stay and justify higher marketing spend.
Small boutique hotels have limited budgets, so every riyal matters. Metasearch and Instagram or Snapchat content often deliver direct bookings at a low cost, while international OTAs remain important for foreign travellers who discover the destination online. Measuring both helps a 30-key property avoid overspending on ads during naturally high-demand months.
Extended-stay properties across Riyadh, Dammam and Al Khobar often win monthly bookings through WhatsApp, corporate relocation contracts and walk-ins. Their cost per booking may be high in riyals but very low per night, which is the right lens for long-stay business.
This comparison shows why many hotels misjudge the profitability of their channels when they look only at commission.
| Question | Commission-Only View | Real Cost Per Booking View |
|---|---|---|
| What does a direct booking cost? | Almost nothing | Ads + booking engine + payment fees + loyalty (SAR 184 in our example) |
| Is wholesale cheap? | Yes, no commission | Low CPB but lowest net revenue per night due to discounted rates |
| How are cancellations treated? | Ignored | Fixed costs spread over stayed bookings only |
| How is staff time treated? | Overhead, not a channel cost | Allocated to voice, WhatsApp, corporate and groups |
| What decision does it support? | "Push everything to direct" | "Optimise each channel for net revenue per night" |
Direct is usually cheaper, but OTAs provide global reach, trusted reviews and a "billboard effect", where guests discover your hotel on an OTA and then book directly. The goal is not to eliminate OTAs. It is to use them where they add incremental demand and grow direct share where your cost per booking is lower.
✅ Proven Levers to Lower Distribution Costs
Saudi Arabia's tourism ambitions are reshaping hotel distribution. After passing 100 million visits in 2023, the Kingdom raised its Vision 2030 target to 150 million annual visits, supported by giga-projects such as the Red Sea, Diriyah and NEOM, and by new hotel supply across Riyadh, Jeddah and AlUla. More rooms mean more competition for every booking, which makes cost discipline a strategic advantage.
Modern revenue and marketing tools increasingly connect PMS, booking engine and ad data automatically. Hotels will move from monthly spreadsheets to near real-time cost per booking dashboards that adjust channel strategy by date.
Travellers now ask AI assistants for hotel recommendations. Hotels with clear, structured, trustworthy website content are more likely to appear in AI-generated answers. This Generative Engine Optimization (GEO) may become a low-cost acquisition channel that lowers overall cost per booking.
Saudi Arabia is one of the most mobile-first markets in the world. Booking through WhatsApp, Instagram and mobile apps will keep growing, making conversational commerce a key direct channel to measure.
The Kingdom's push toward a cashless economy brings more payment options, each with different fees. National platforms serving pilgrims and visitors will also shape how religious tourism rooms are sold, adding new channels that need their own cost tracking.
As international and local investors fund new Saudi hotels, reporting will shift from gross revenue toward net RevPAR and GOPPAR. Hotels that already measure real cost per booking will be ready for that scrutiny.
It is the total cost of winning and servicing reservations from one channel, including commissions, advertising, payment fees, technology, labour, discounts and cancellation losses, divided by the number of stayed bookings from that channel.
Add up every cost linked to the channel for one month, allocate shared costs such as the channel manager and reservations team, then divide by stayed bookings. Also calculate cost as a percentage of room revenue and net revenue per room night for a complete picture.
There is no single benchmark, because it depends on location, segment and channel mix. Many hotels aim for a blended cost of acquisition in the low-to-mid teens as a percentage of room revenue. The most reliable benchmark is your own trend: aim to lower blended cost while keeping occupancy and ADR stable.
No. Direct bookings are often cheaper, but heavy paid advertising, BNPL payment fees or deep member discounts can push direct cost per booking above OTA levels. Only full-cost measurement shows the truth.
Cancellations do not reduce fixed costs such as ads, subscriptions and staff time. Dividing by gross reservations makes high-cancellation channels look cheaper. Dividing by stayed bookings reveals the real cost, which can be around 30% higher in channels with high cancellation rates.
You need PMS reports by source code, OTA and TMC invoices, booking engine reports, ad platform spend, payment acquirer statements, payroll allocations and technology invoices. A spreadsheet is enough to start; a BI dashboard helps as you scale.
Monthly is the minimum. During peak periods such as Ramadan, Hajj season, Riyadh Season or major conferences, weekly tracking helps you shift spend and inventory quickly.
Vision 2030 is driving rapid growth in visitors and new hotel supply. Higher competition can raise advertising and OTA visibility costs, so hotels that measure real cost per booking will be better able to protect margins while capturing the growth.
Your hotel cost per booking is far more than a commission rate. It includes marketing, payments, technology, labour, discounts and the hidden impact of cancellations. When you measure it properly, channel by channel, you replace guesswork with evidence.
The worked Riyadh example shows the core lesson clearly. The channel with the lowest cost per booking is not always the most profitable, and the channel with the highest commission is not always the one to cut. The winning metric is net revenue per room night after all acquisition costs.
For Saudi hotels, the timing could not be better. Vision 2030 is bringing more visitors, more rooms and more competition. Properties that understand their true total cost of distribution will spend smarter, negotiate better and grow profitably, from the Haram to the Red Sea.
Ready to Discover Your Hotel's Real Cost Per Booking?
Get a clear channel-by-channel cost analysis, a net revenue scorecard and a practical plan to grow direct bookings for your Saudi property.
Request Your Free Distribution Cost Audit????️ Tags:
hotel cost per booking, real cost per booking hotels, hotel distribution costs, cost of acquisition hotels, OTA commission Saudi Arabia, direct booking vs OTA cost, hotel channel mix optimization, total cost of distribution, net RevPAR, hotel customer acquisition cost, how to calculate cost per booking for hotels, reduce hotel distribution costs Saudi Arabia, hotel revenue management Riyadh, Makkah hotel distribution strategy, Vision 2030 hospitality, Saudi hotel industry, hotel direct booking strategy, GDS costs hotels, metasearch hotel marketing, WhatsApp hotel bookings
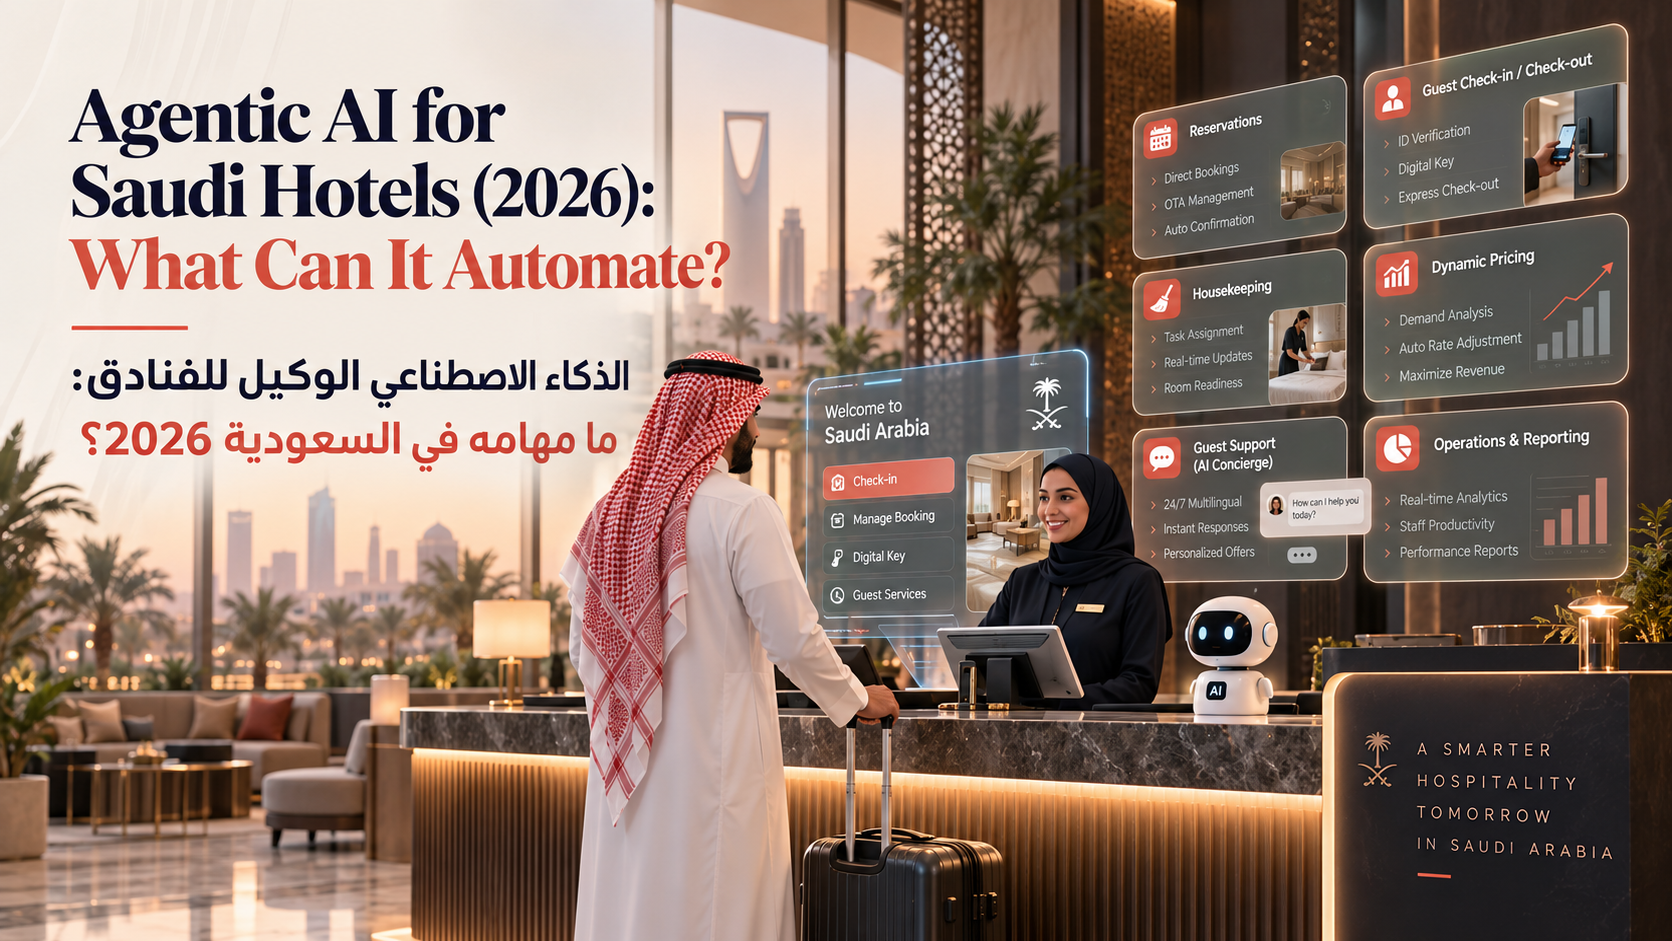
Discover what agentic AI can automate in Saudi hotels in 2026, from WhatsApp bookings and dynamic pricing to housekeeping, ZATCA invoicing and reports....
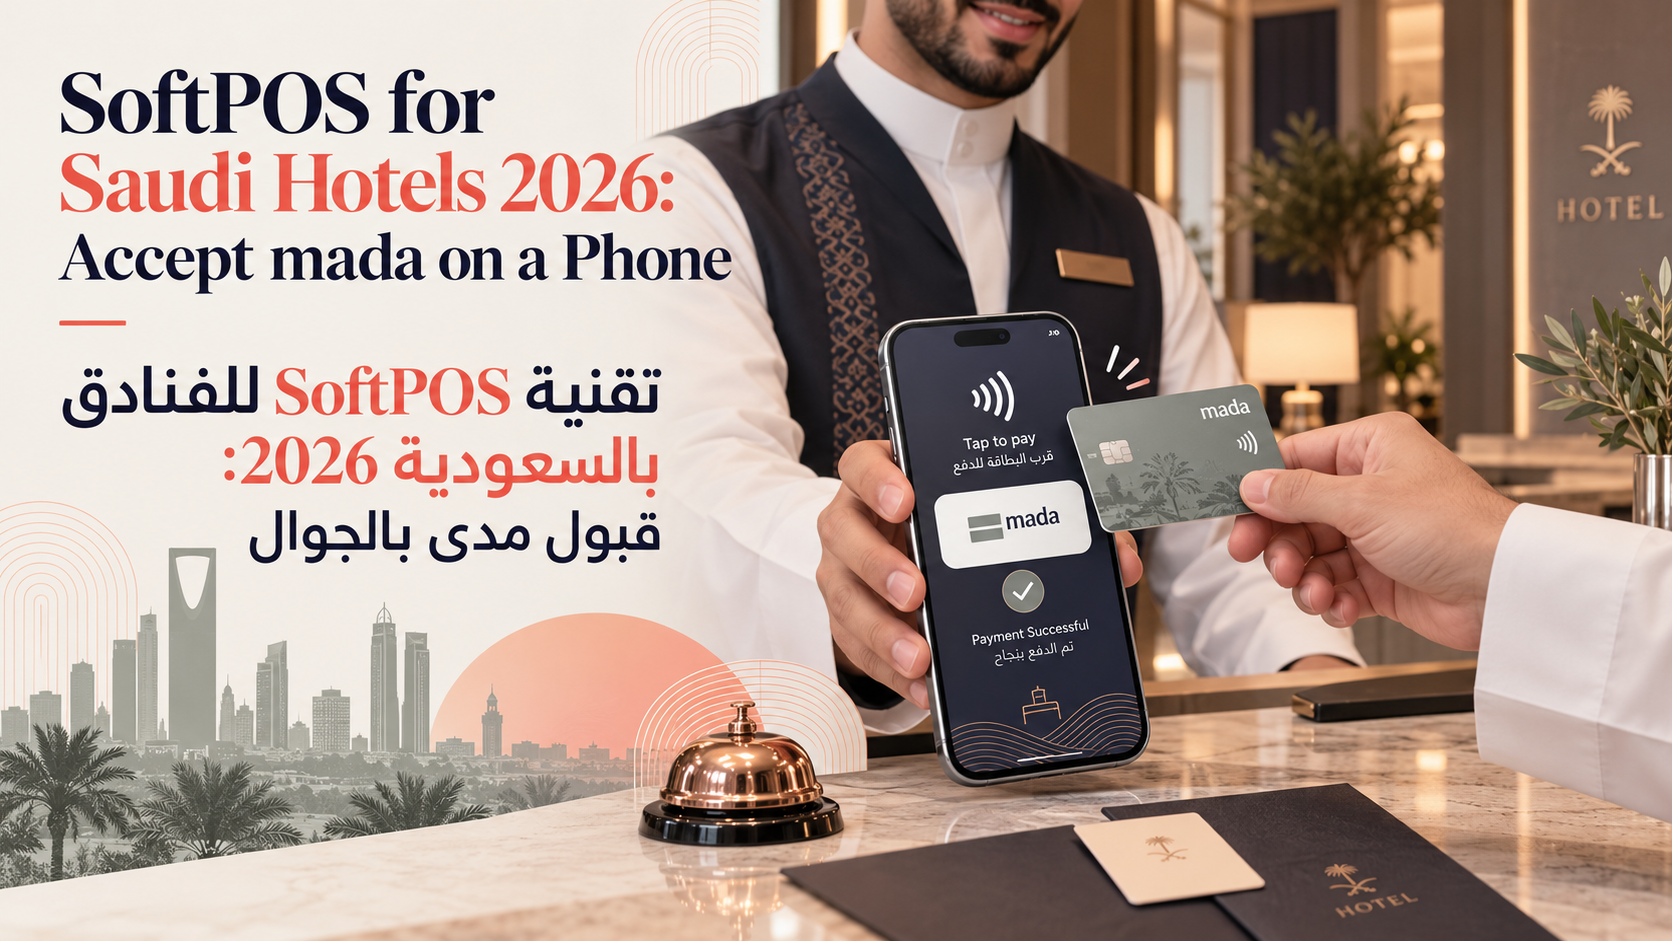
Can Saudi hotels accept mada on a phone? Discover how SoftPOS works in 2026, its security, SAMA requirements, fees, and hotel PMS integration....

Prepare Al Khobar hotels for Ithra Design Week, Nov 16–21, 2026, with a 6-day direct booking plan, smart hotel PMS, dynamic pricing, and lower OTA commissions....

Discover a 7-day revenue plan for Al Khobar and Dammam hotels around PFL MENA and CIDEX 2026, with dynamic pricing, group blocks and more direct bookings....
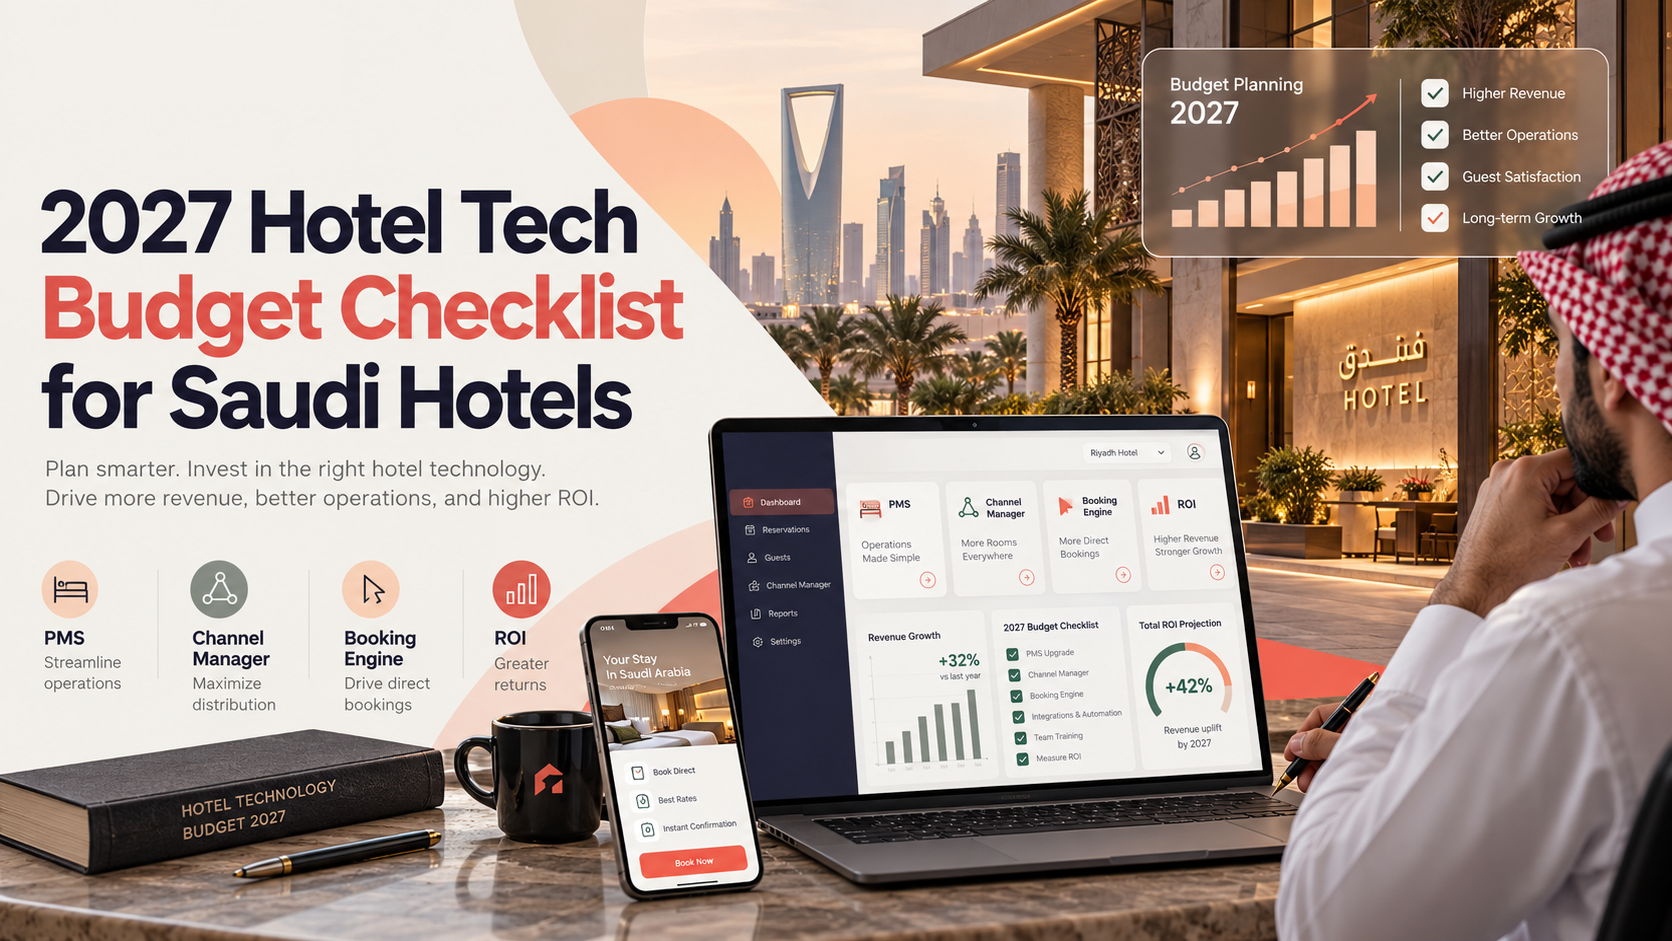
Plan your 2027 hotel technology budget with our Saudi hotel checklist. Compare PMS, channel manager and booking engine ROI, costs and Vision 2030 priorities....
Learn how Al Khobar hotels turn Bahrain weekend visitors into direct bookings using smart pricing, a fast booking engine, WhatsApp and guest loyalty offers....
Manage monthly stays, security deposits and company bookings with Fandaqah PMS for Saudi serviced apartments, including ZATCA invoicing and Shomoos....
Manage corporate long stays, negotiated company rates, staff rotations and ZATCA-ready billing in Dhahran and Dammam with Fandaqah PMS....

Complete guide to Six Kings Slam Riyadh 2026: format, prize money, past champions, tickets, where to stay, and how Saudi hotels can maximize revenue during the event....

FII10 Riyadh 2026 hotelier guide: dates, attendees, smart hotel tech, booking strategies & pricing tips to maximize RevPAR during the Future Investment Initiative....
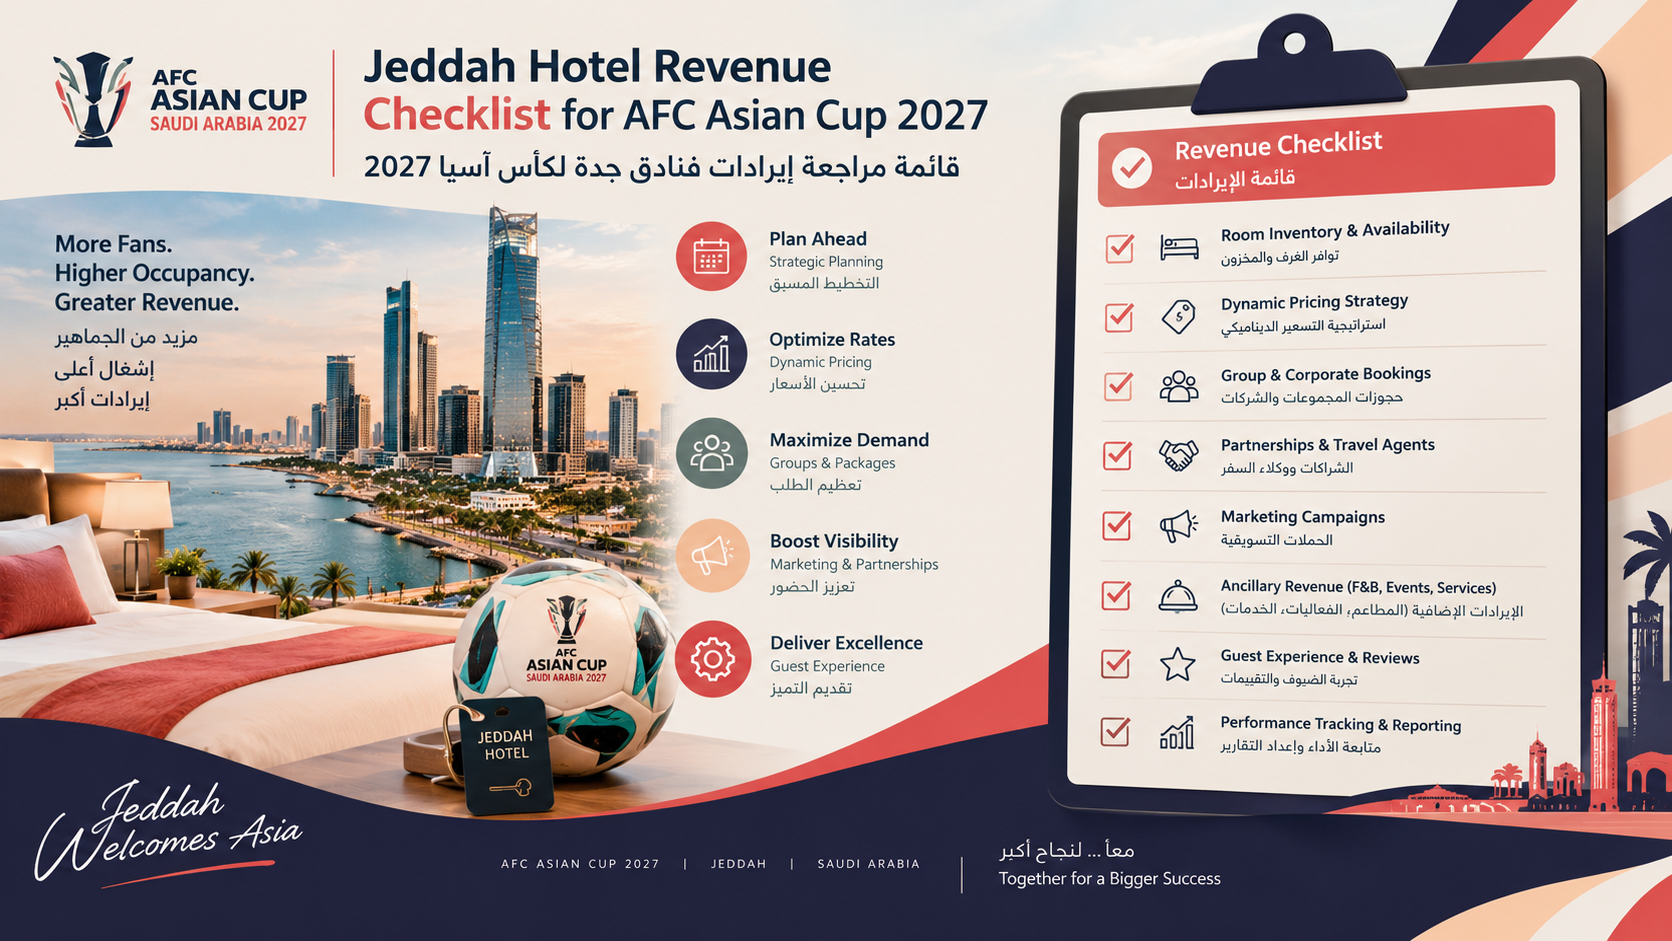
Step-by-step revenue management checklist for Jeddah hotels preparing for AFC Asian Cup 2027: demand forecasting, dynamic pricing, MLOS, channels and RevPAR....
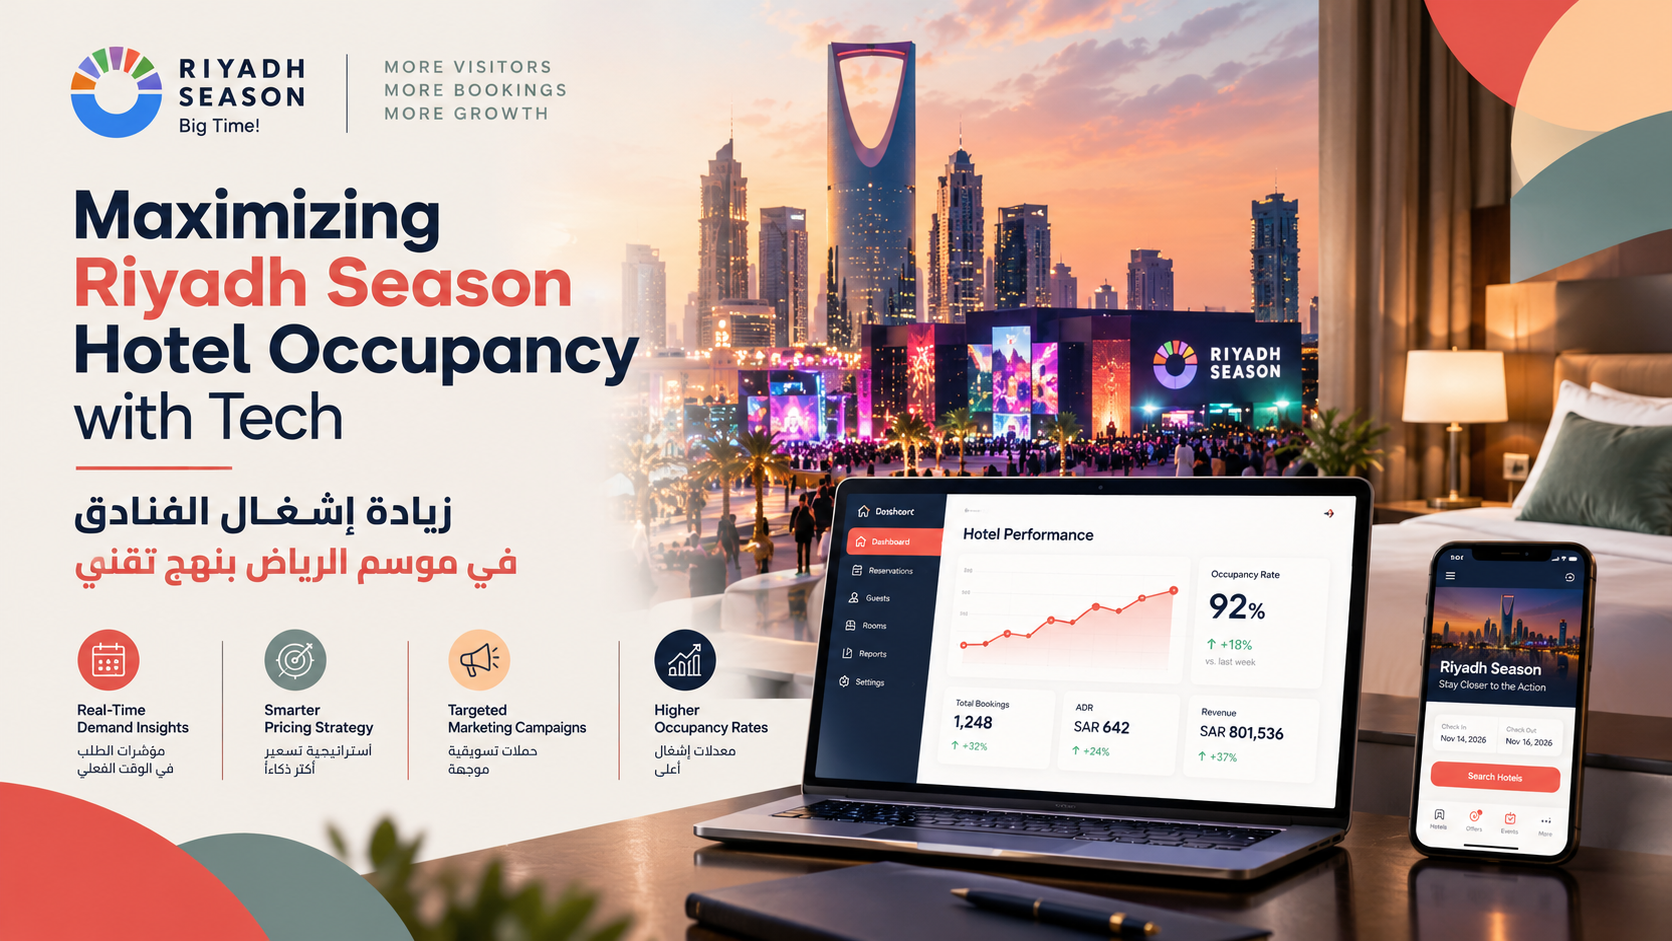
How Riyadh hotels can maximize occupancy and RevPAR during Riyadh Season using dynamic pricing, channel managers, direct bookings and cloud PMS like Fandaqah....

The Gulf Cup in Saudi Arabia draws thousands of football fans. Learn how hotels boost bookings with match-day pricing, fan packages & a smart cloud PMS....

Saudi Arabia winter vacation 2026 is peak domestic travel season. Learn how hotels attract students & families with packages, smart pricing & a cloud PMS....
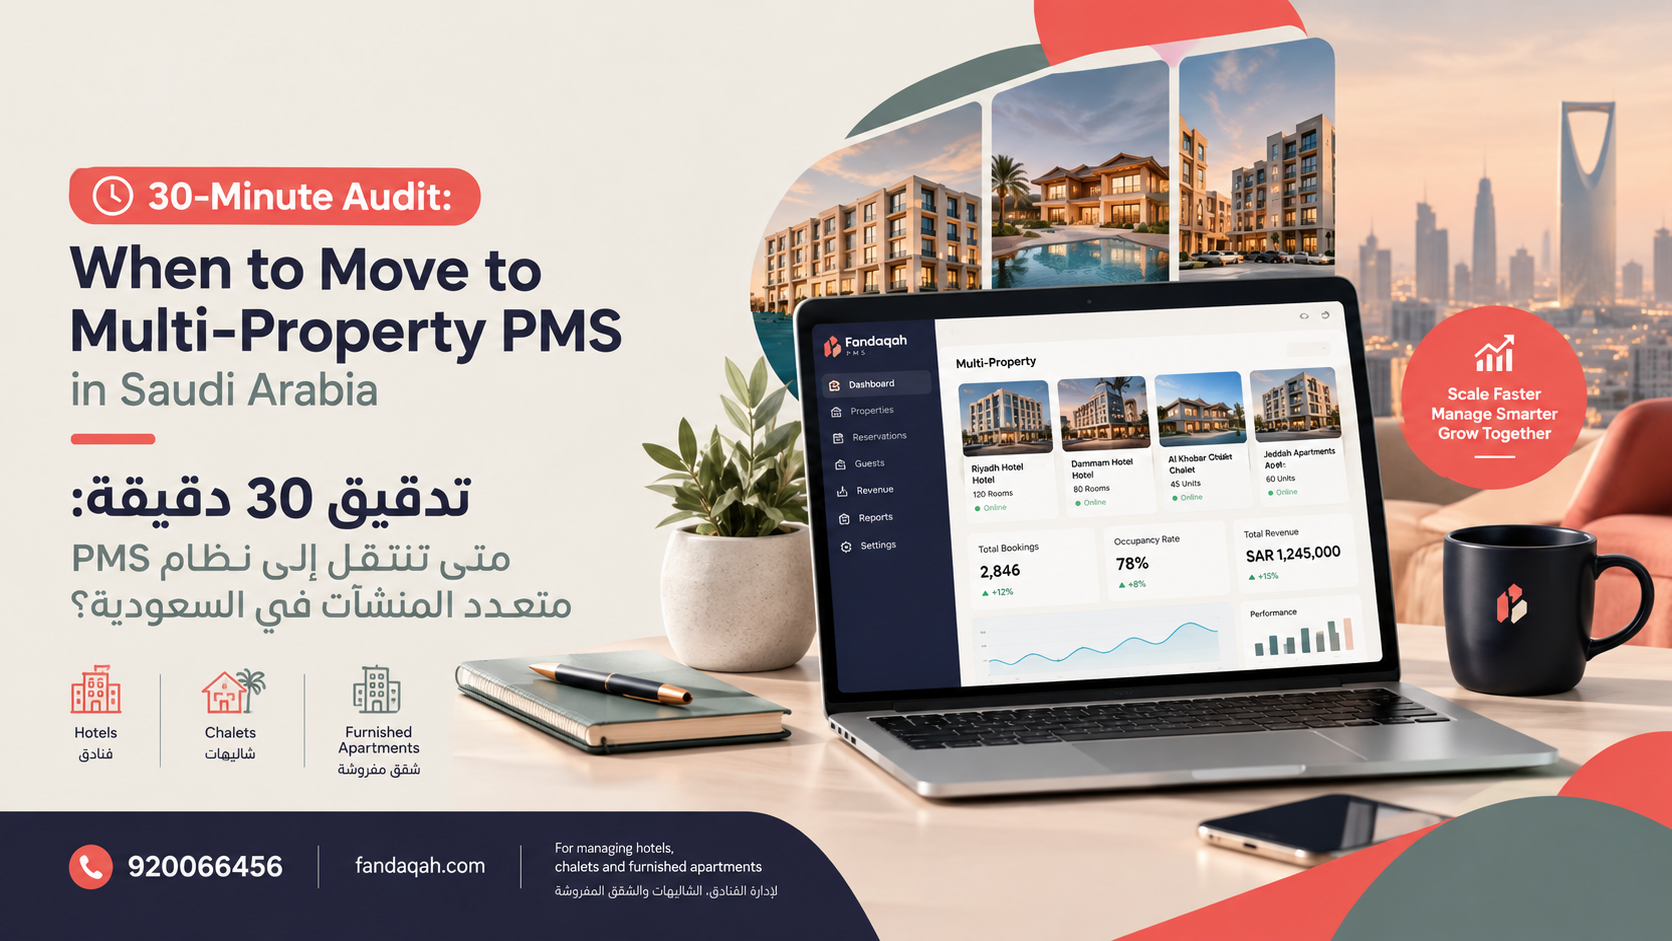
Run this 10-question, 30-minute audit to know if your hotel group needs a multi-property PMS. Compare single vs multi-property systems, Saudi use cases, ZATCA readiness & Vision 2030 tips....
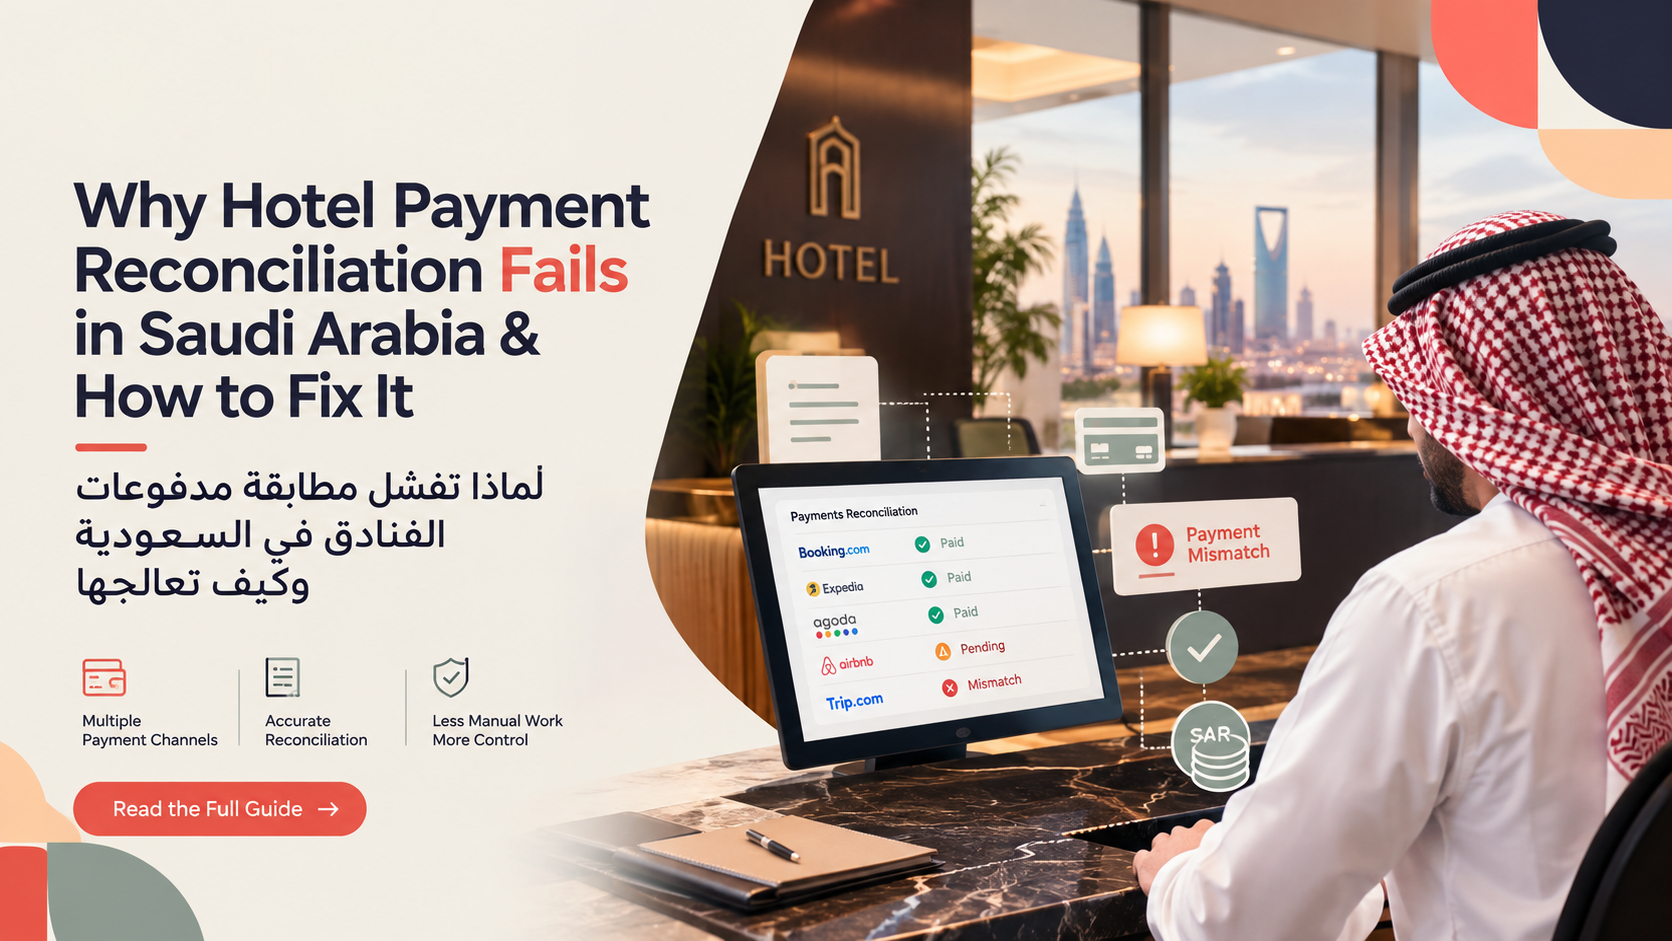
Hotel payment reconciliation fails in Saudi hotels due to mada, OTAs, ZATCA & timing gaps. Learn the 7 root causes, a step-by-step fix, checklist & how automation recovers lost revenue....
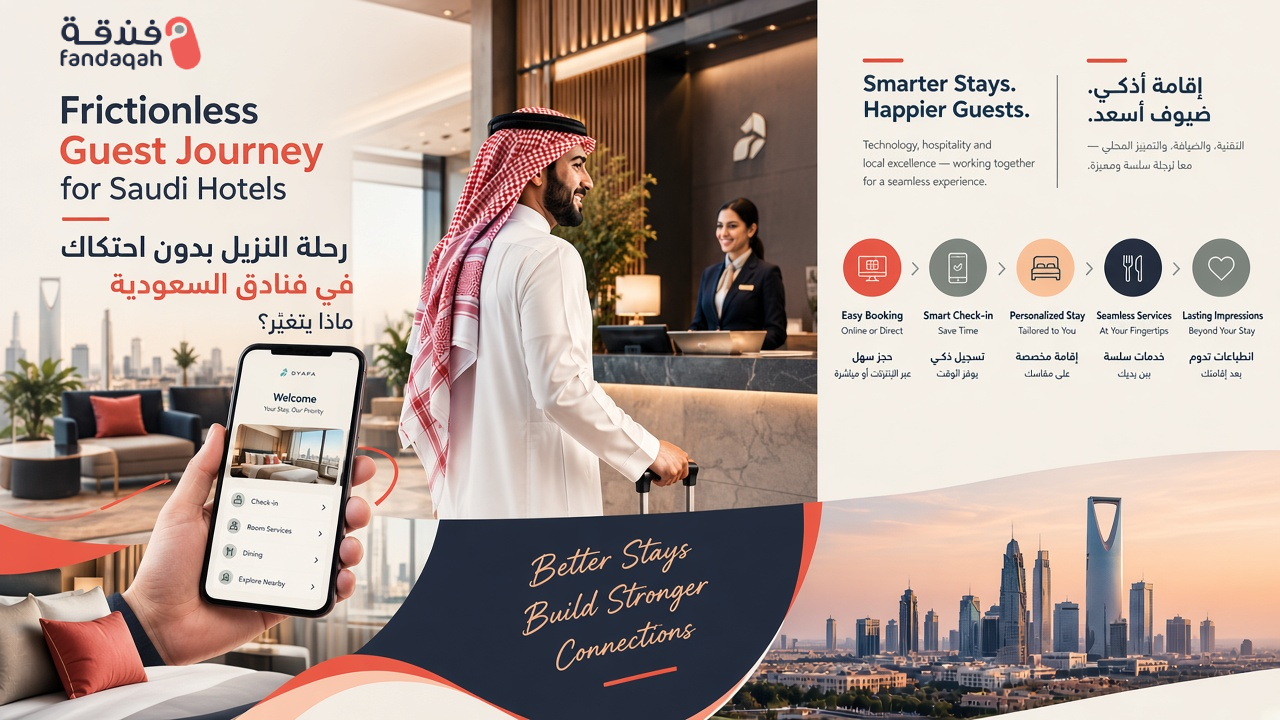
What really changes when Saudi hotel managers fix the frictionless guest journey. Faster check-in, higher direct bookings, better reviews, and full Shomoos & ZATCA compliance....
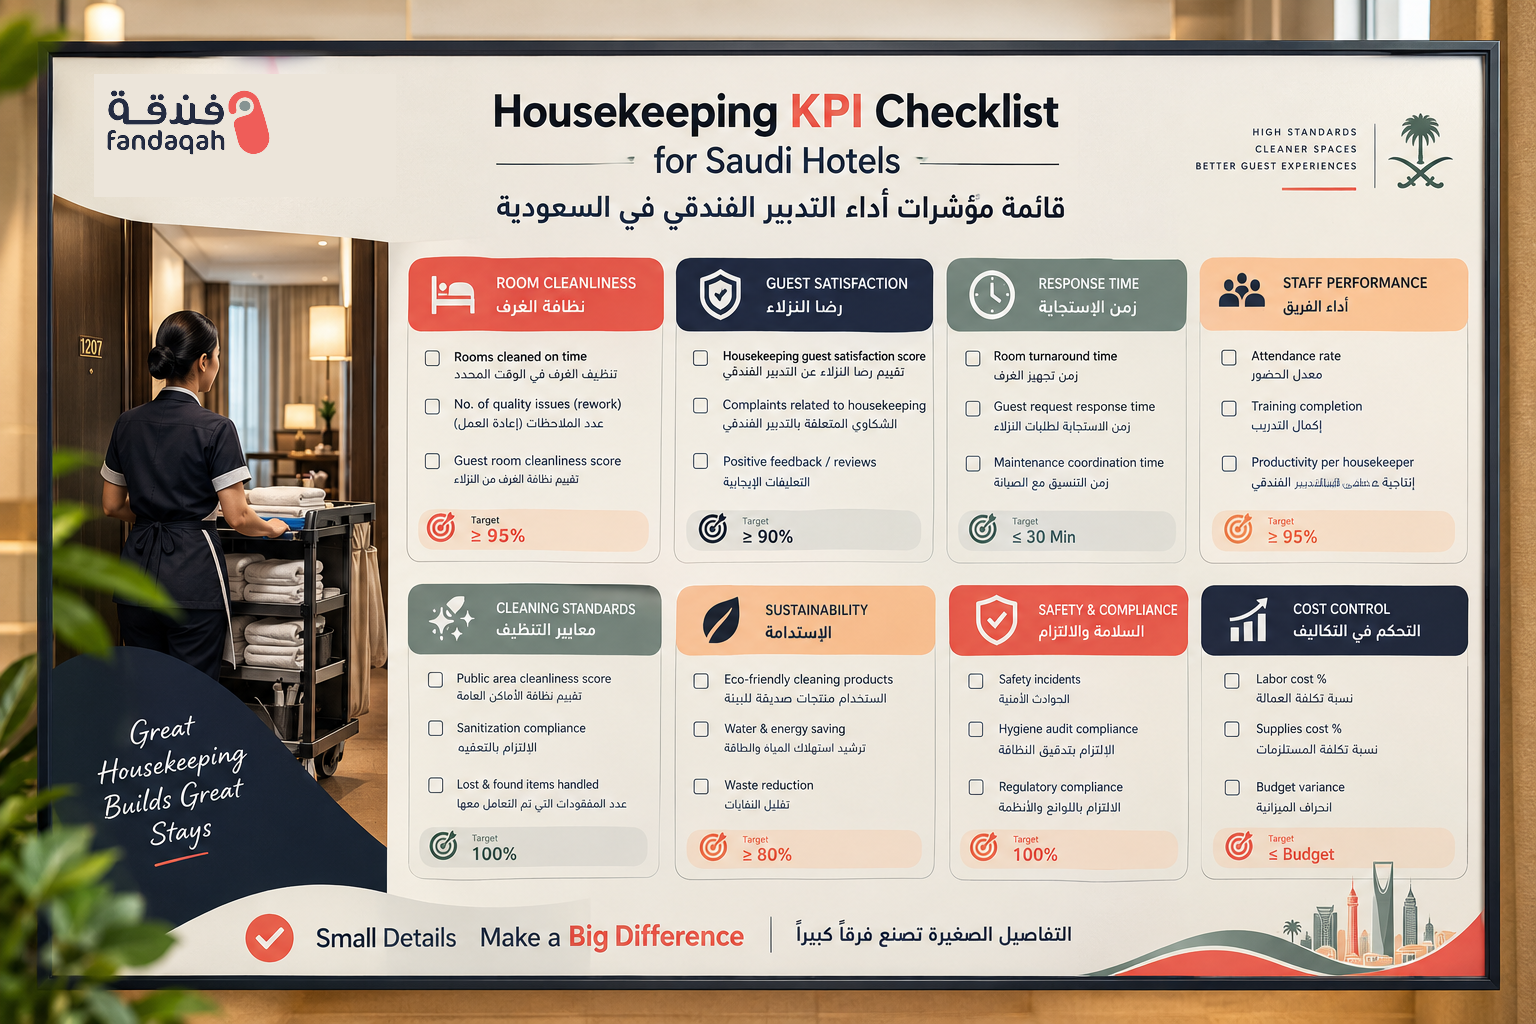
Complete housekeeping KPI checklist for Saudi hotels. Track room status, turnaround time, productivity & more. Design a digital board that drives performance under Vision 2030....
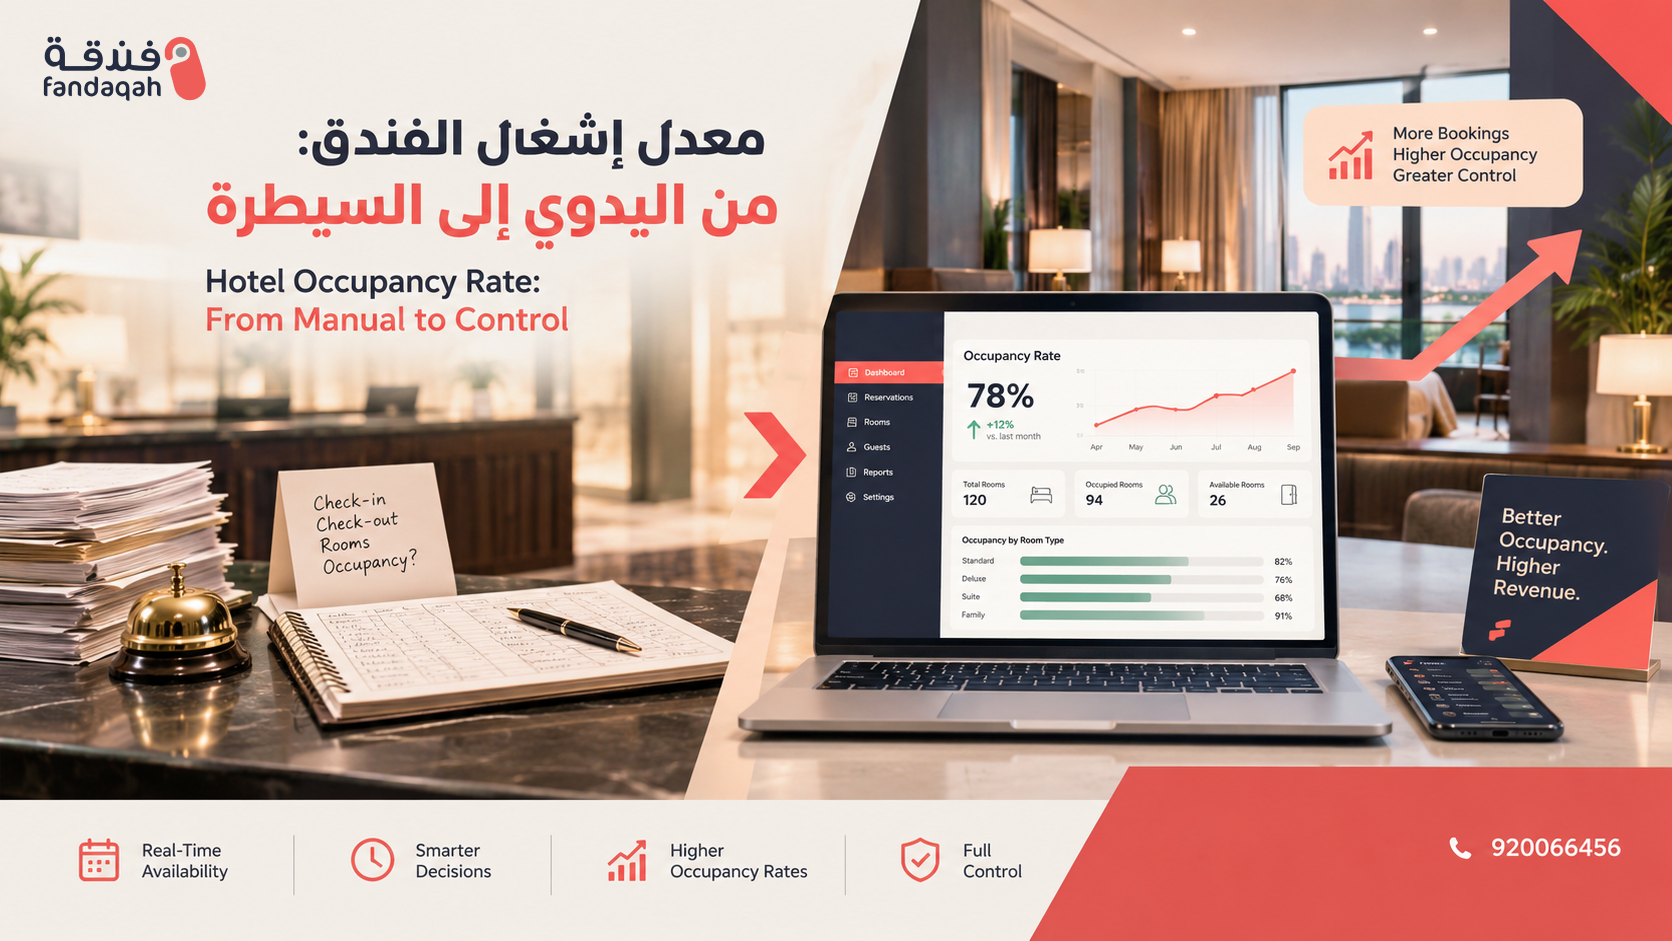
Learn how to calculate hotel occupancy rate, link it to ADR & RevPAR, fix manual errors, and grow revenue in Saudi Arabia with real-time PMS control....
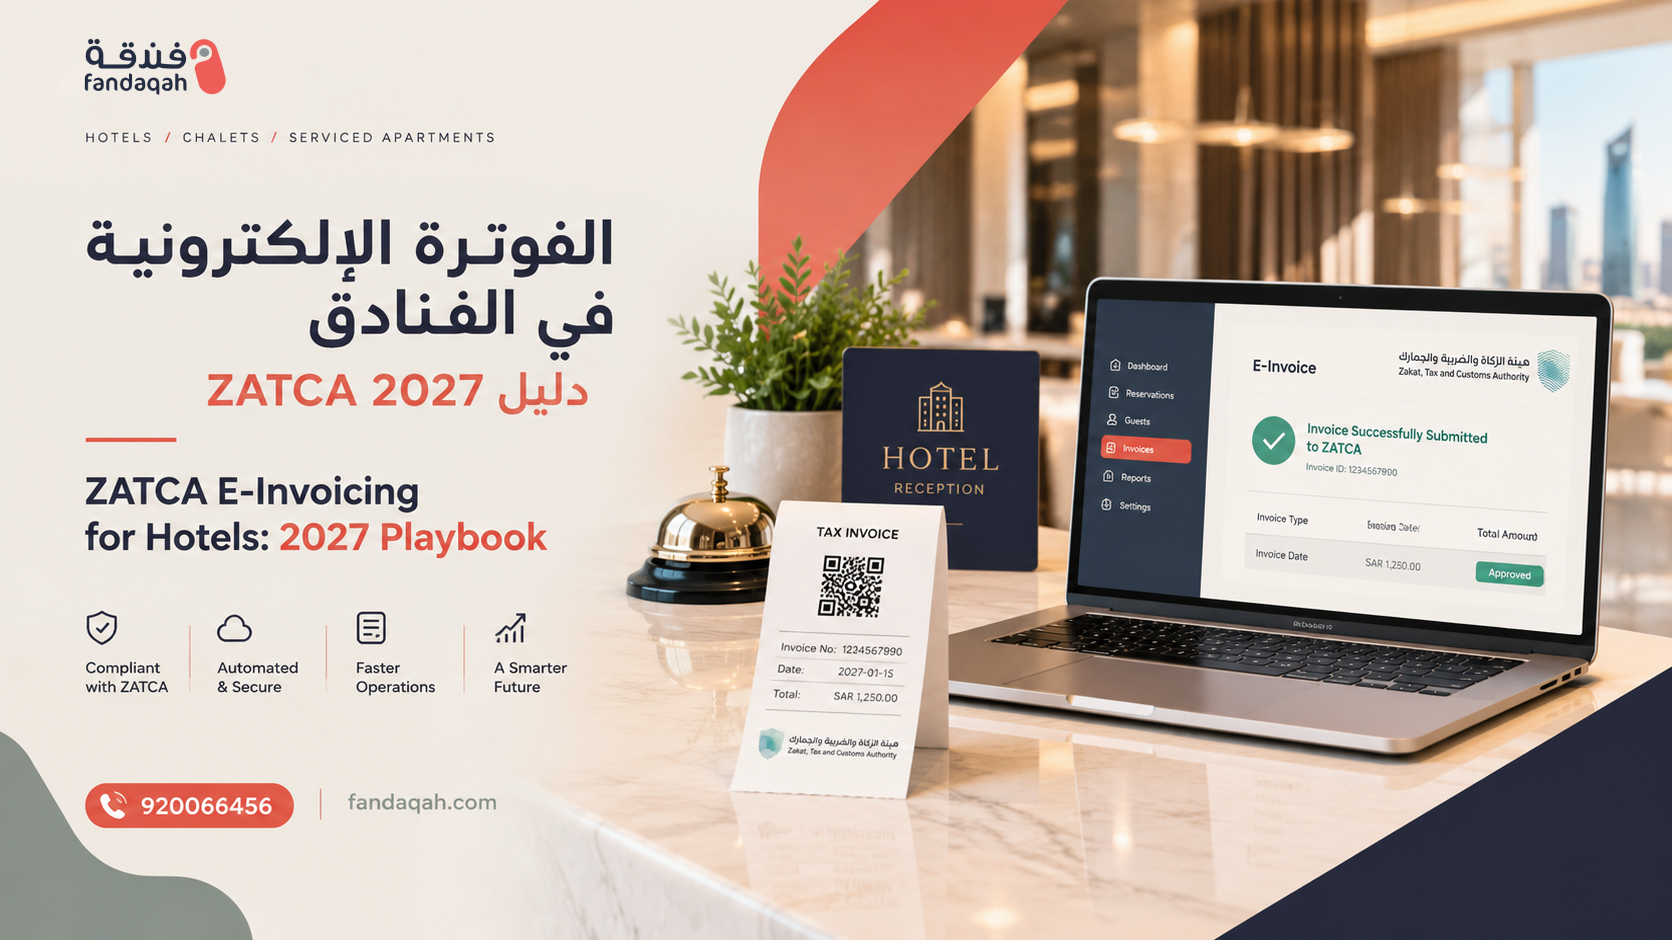
Practical 2027 guide to ZATCA e-invoicing for Saudi hotels: Phase 2, clearance vs reporting, deposits, credit notes, group/corporate billing & compliance steps....
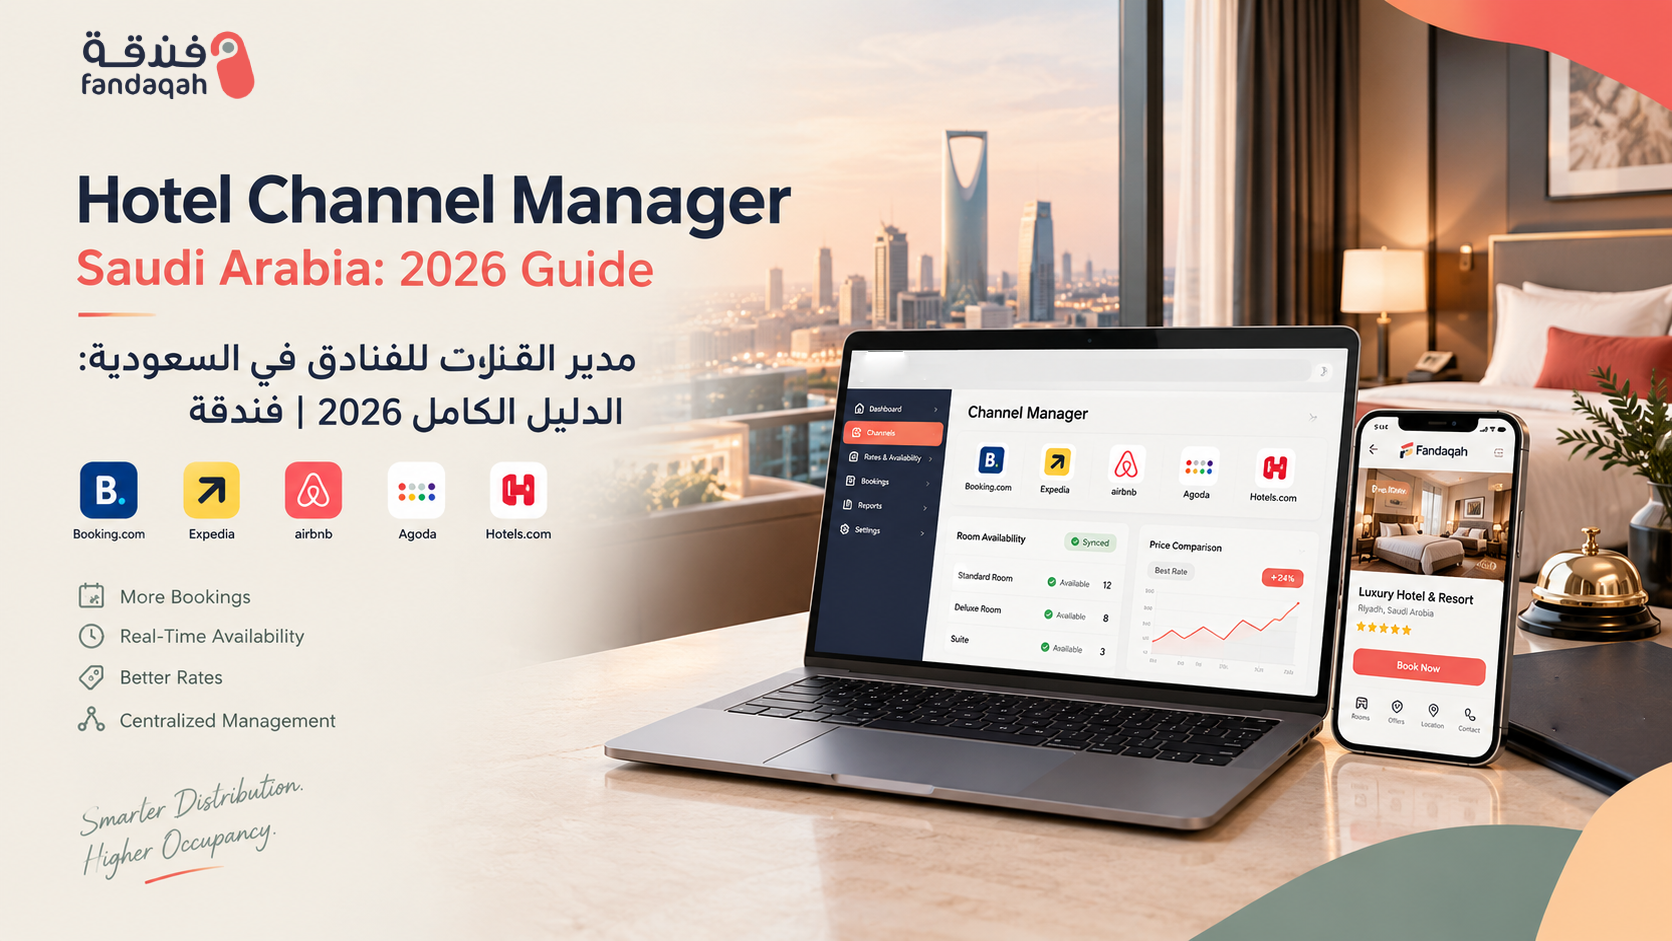
Learn how a hotel channel manager works in Saudi Arabia: prevent overbooking, protect rate parity, sync inventory in real time, and grow bookings for KSA hotels....
Before buying a hotel booking engine in Saudi Arabia, check mada & Apple Pay, Arabic RTL, mobile speed, real-time PMS sync, PDPL & ZATCA readiness....
Improve your hotel PMS selection criteria in Saudi Arabia: ZATCA, Shomoos, PDPL, Arabic support, integrations, scoring model, use cases and vendor proof checklist....
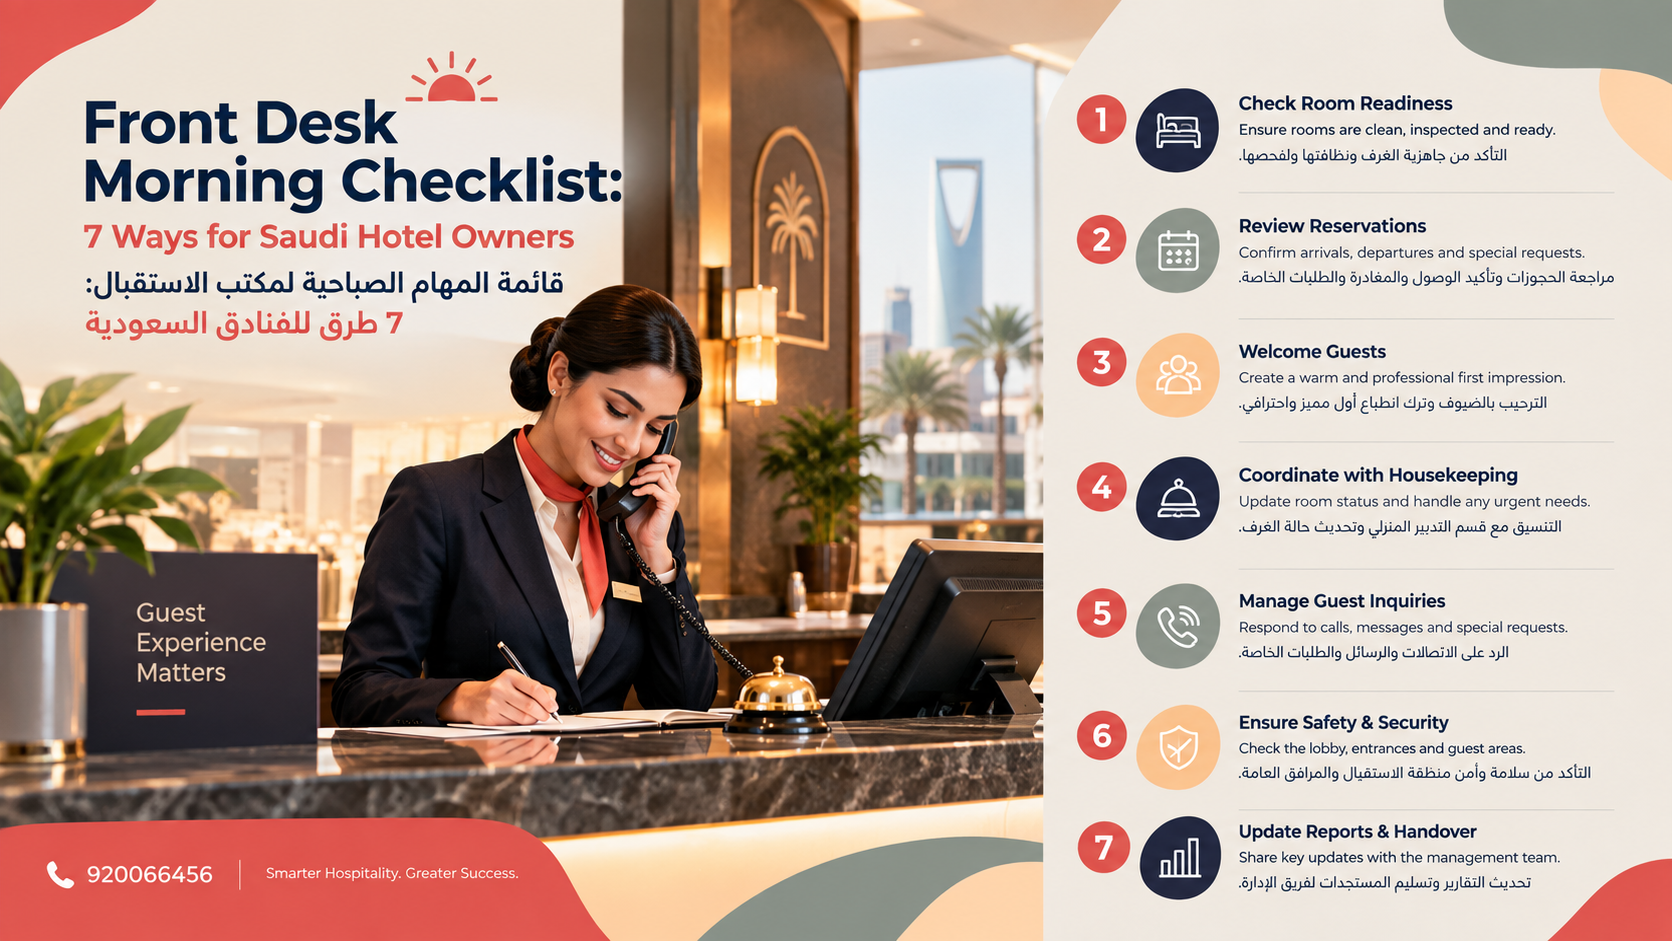
Improve your hotel front desk morning checklist with 7 proven ways for Saudi hotels: shift handover, Shomoos, ZATCA, housekeeping sync, arrivals and Ramadan tips....
Learn how Fandaqah’s hotel channel manager in Saudi Arabia stops overbookings with real-time inventory sync, cuts OTA commissions, and grows direct bookings from 0 to 100 a month....
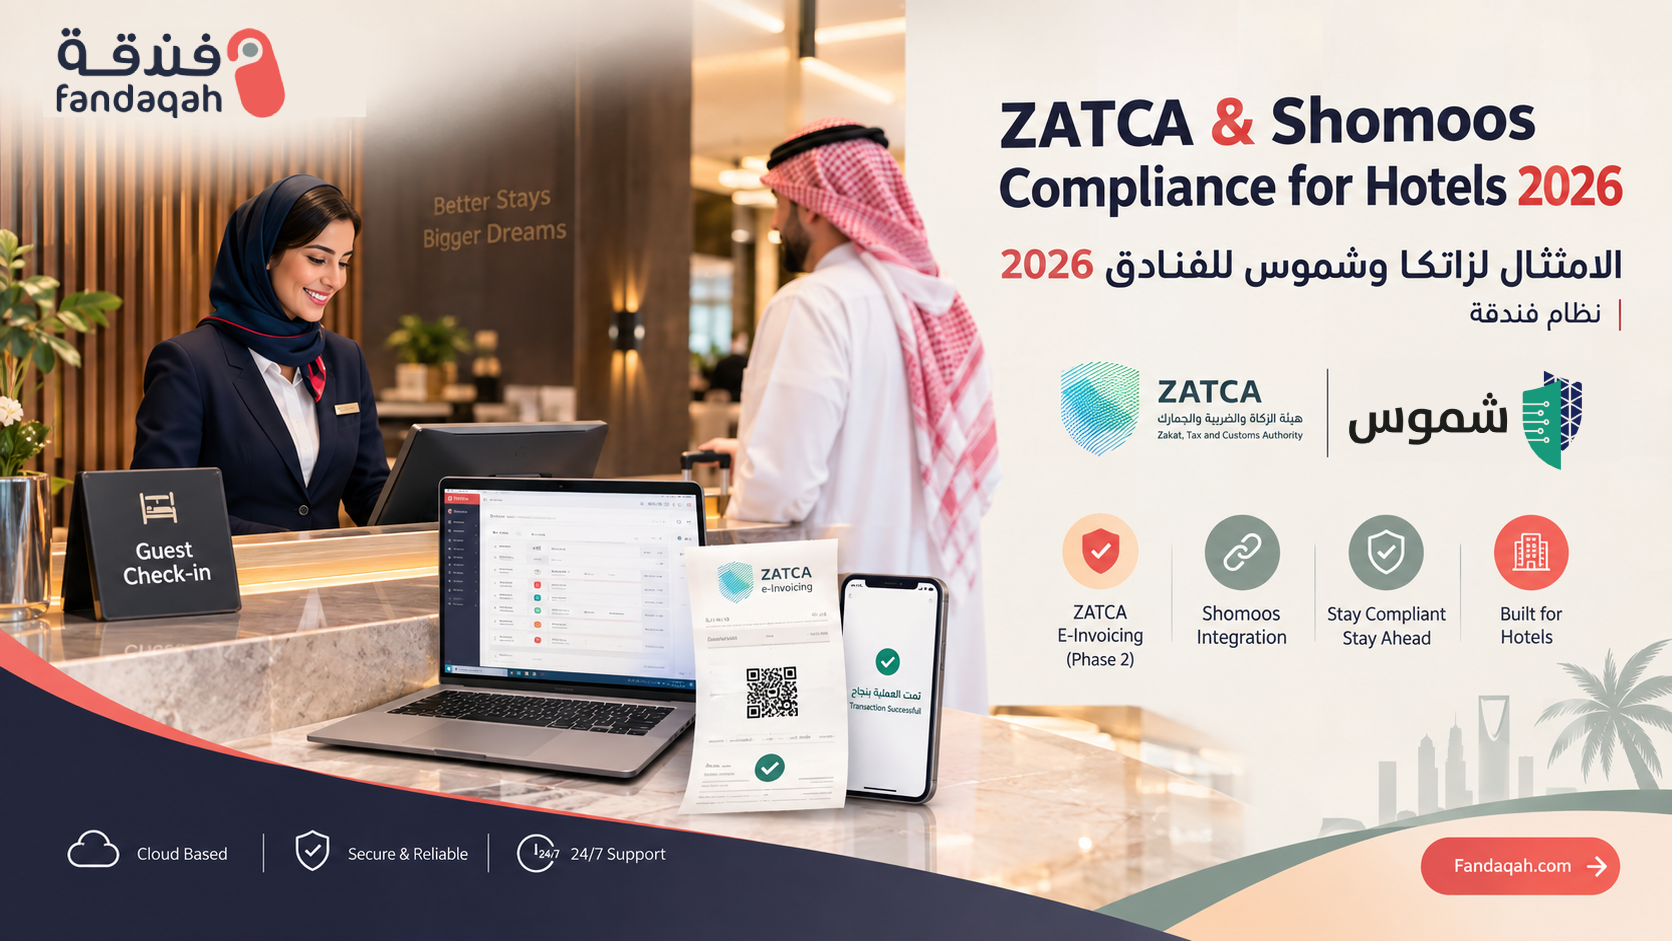
Complete 2026 guide to ZATCA e-invoicing Phase 2 and Shomoos guest registration. See how Fandaqah’s Saudi hotel PMS automates both from a single check-in....
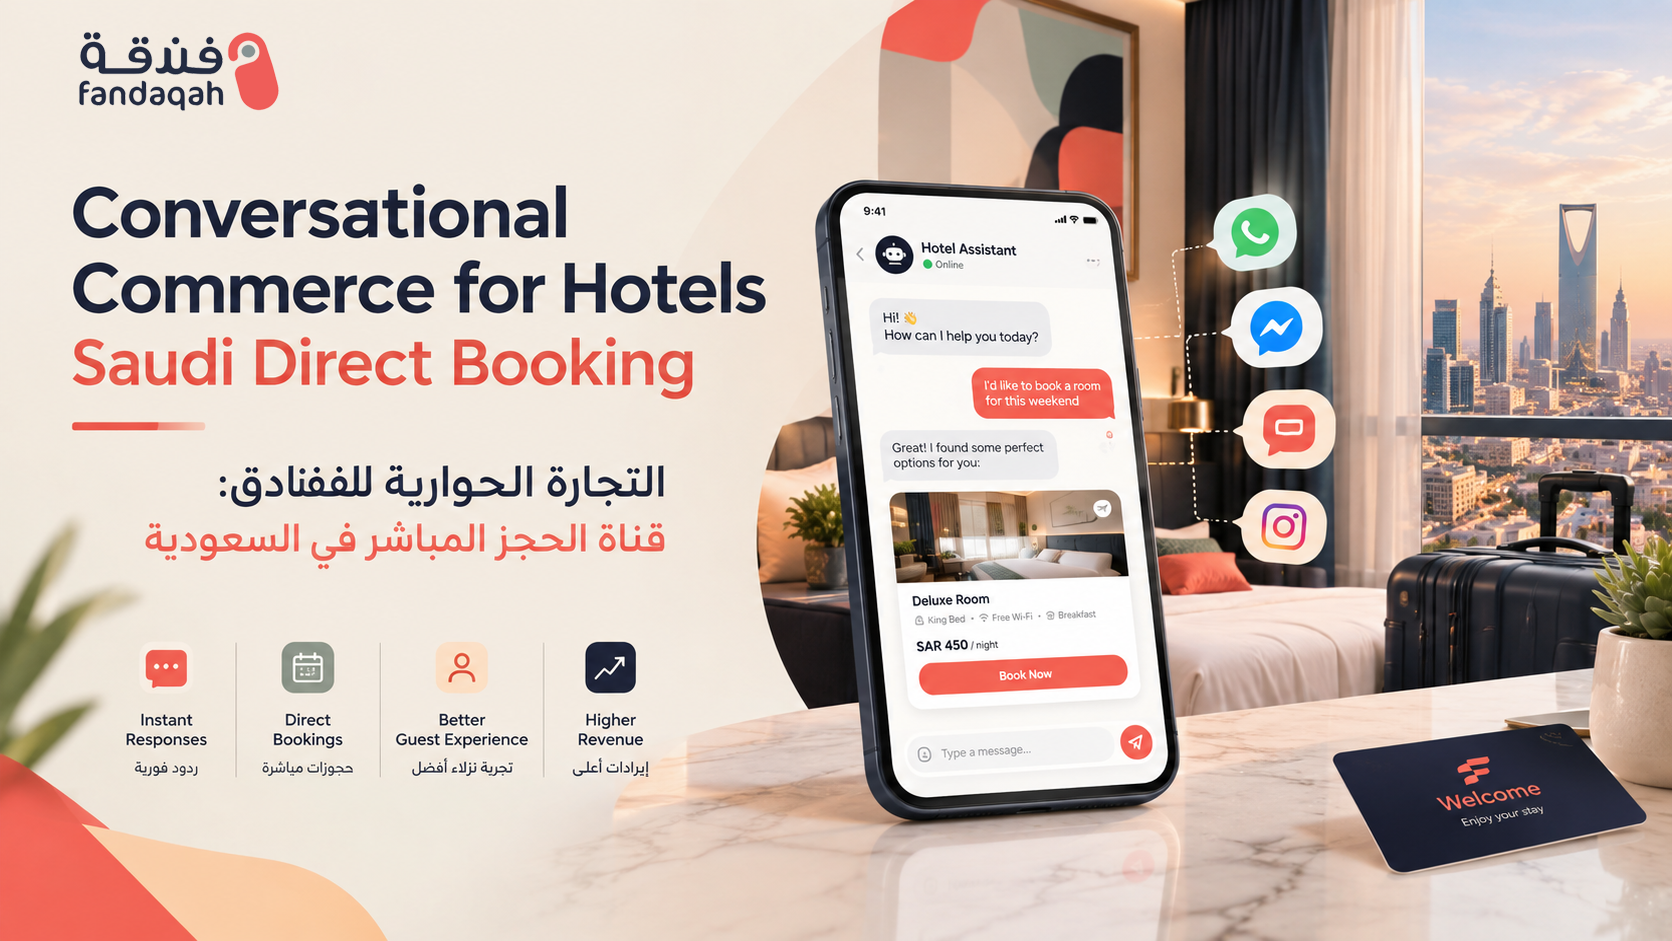
How WhatsApp hotel booking, AI assistants & in-chat payments turn guest chats into direct reservations. Build a commission-free channel for Saudi hotels....

Learn how to calculate the true cost of a hotel stay in Saudi Arabia. Discover when breakfast and parking are worth it, how to get room upgrades, and when flexible rates save you money....
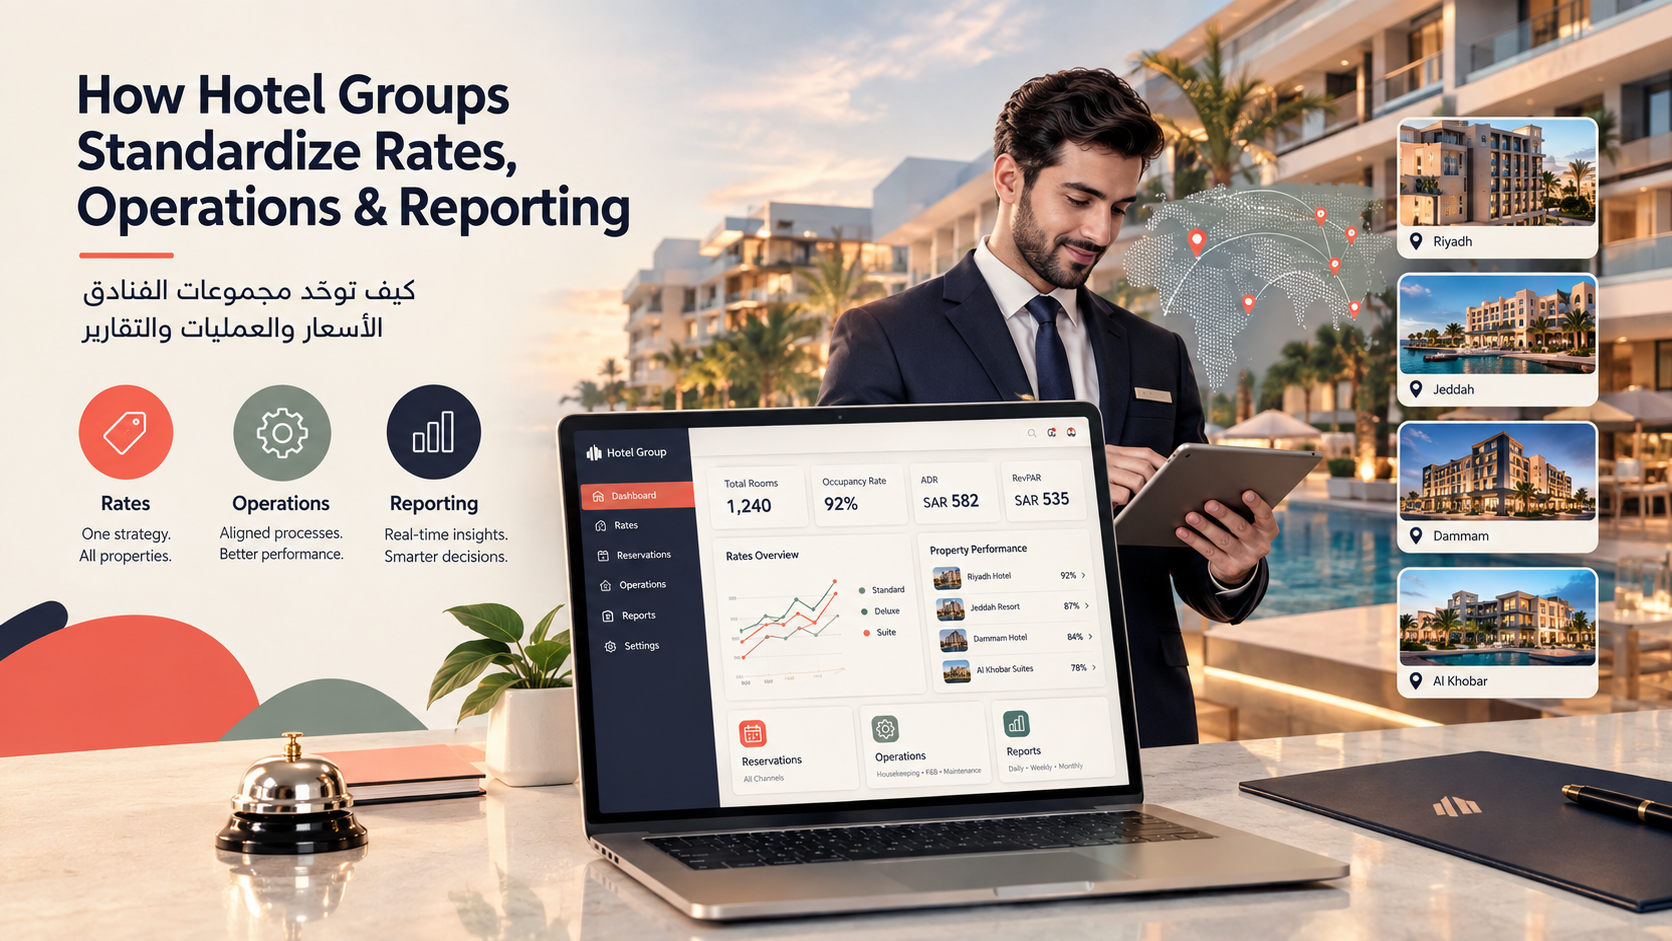
Learn how Saudi hotel groups standardize rates, operations and reporting across properties with a multi-property PMS, shared KPIs and scalable processes....
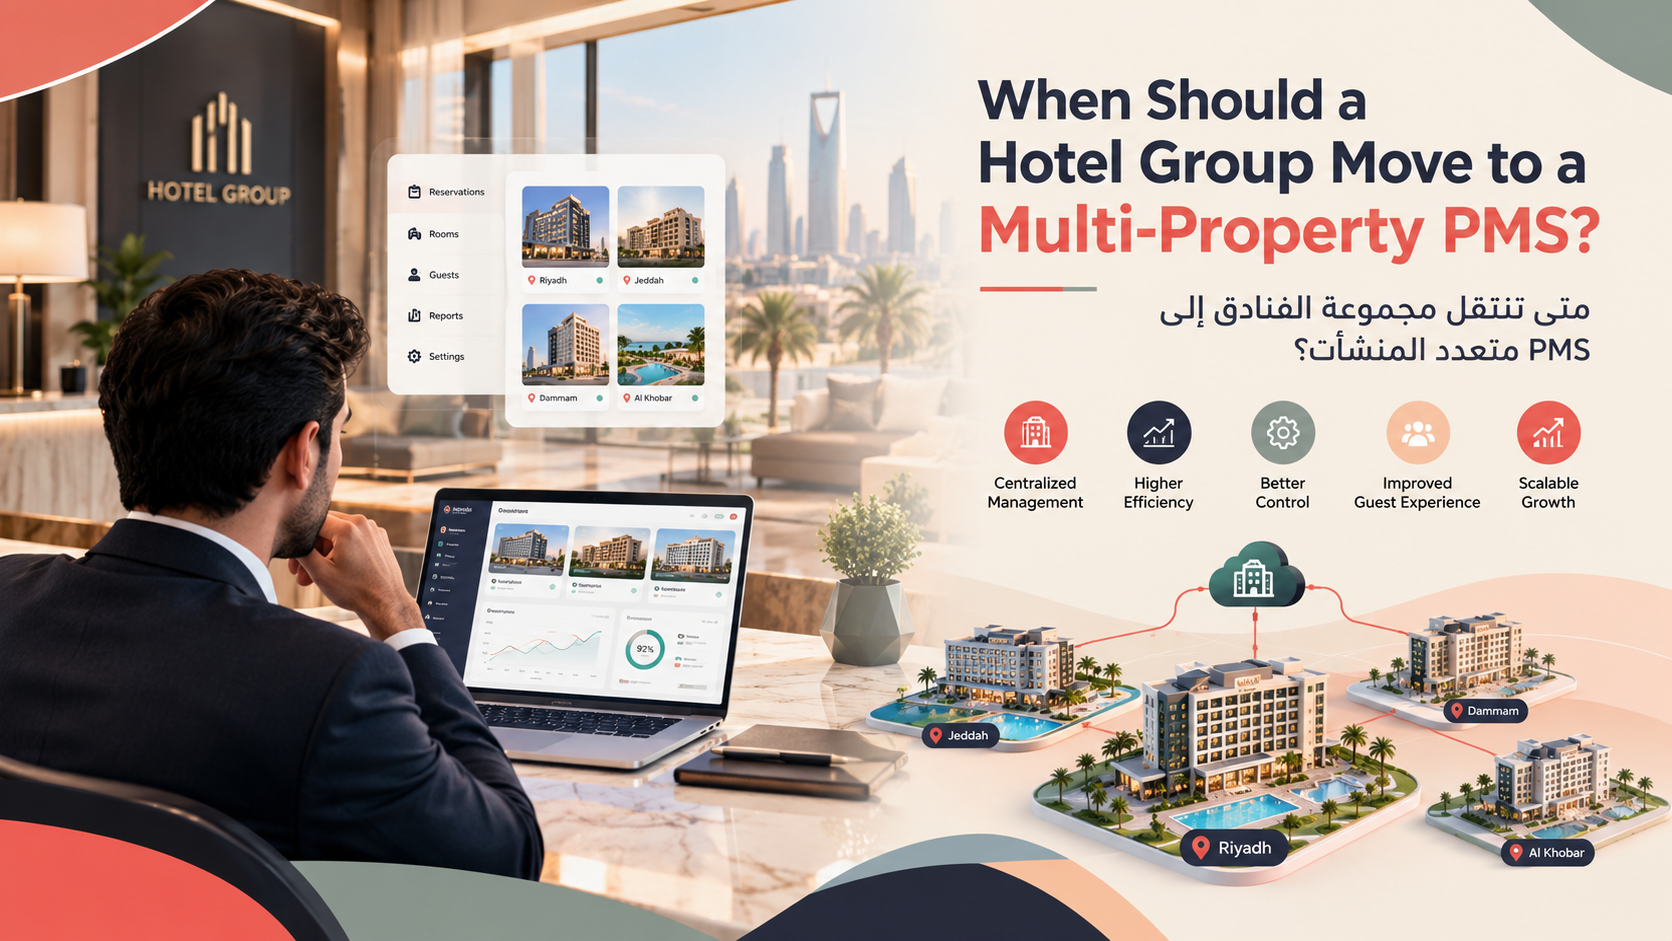
Discover the practical signs a growing hotel group has outgrown separate systems and should switch to a multi-property PMS for better control, reporting, and scale in Saudi Arabia....
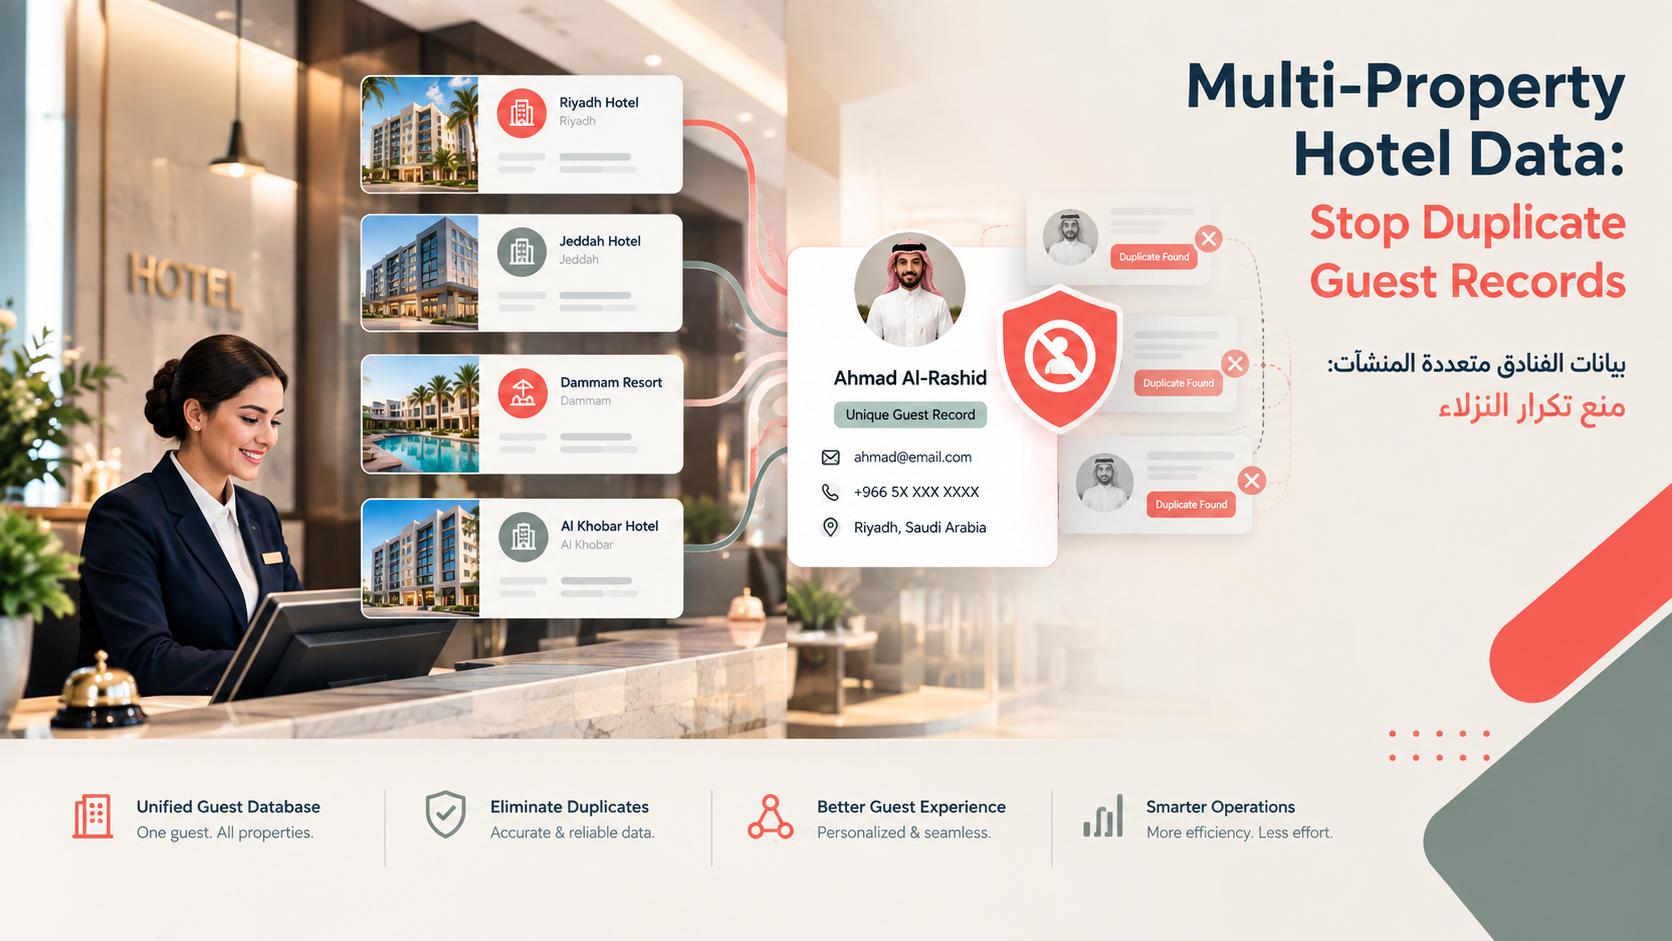
Learn how multi-property hotels in Saudi Arabia stop duplicate guest and reservation records with a centralized PMS, smart matching, channel sync, and data governance....
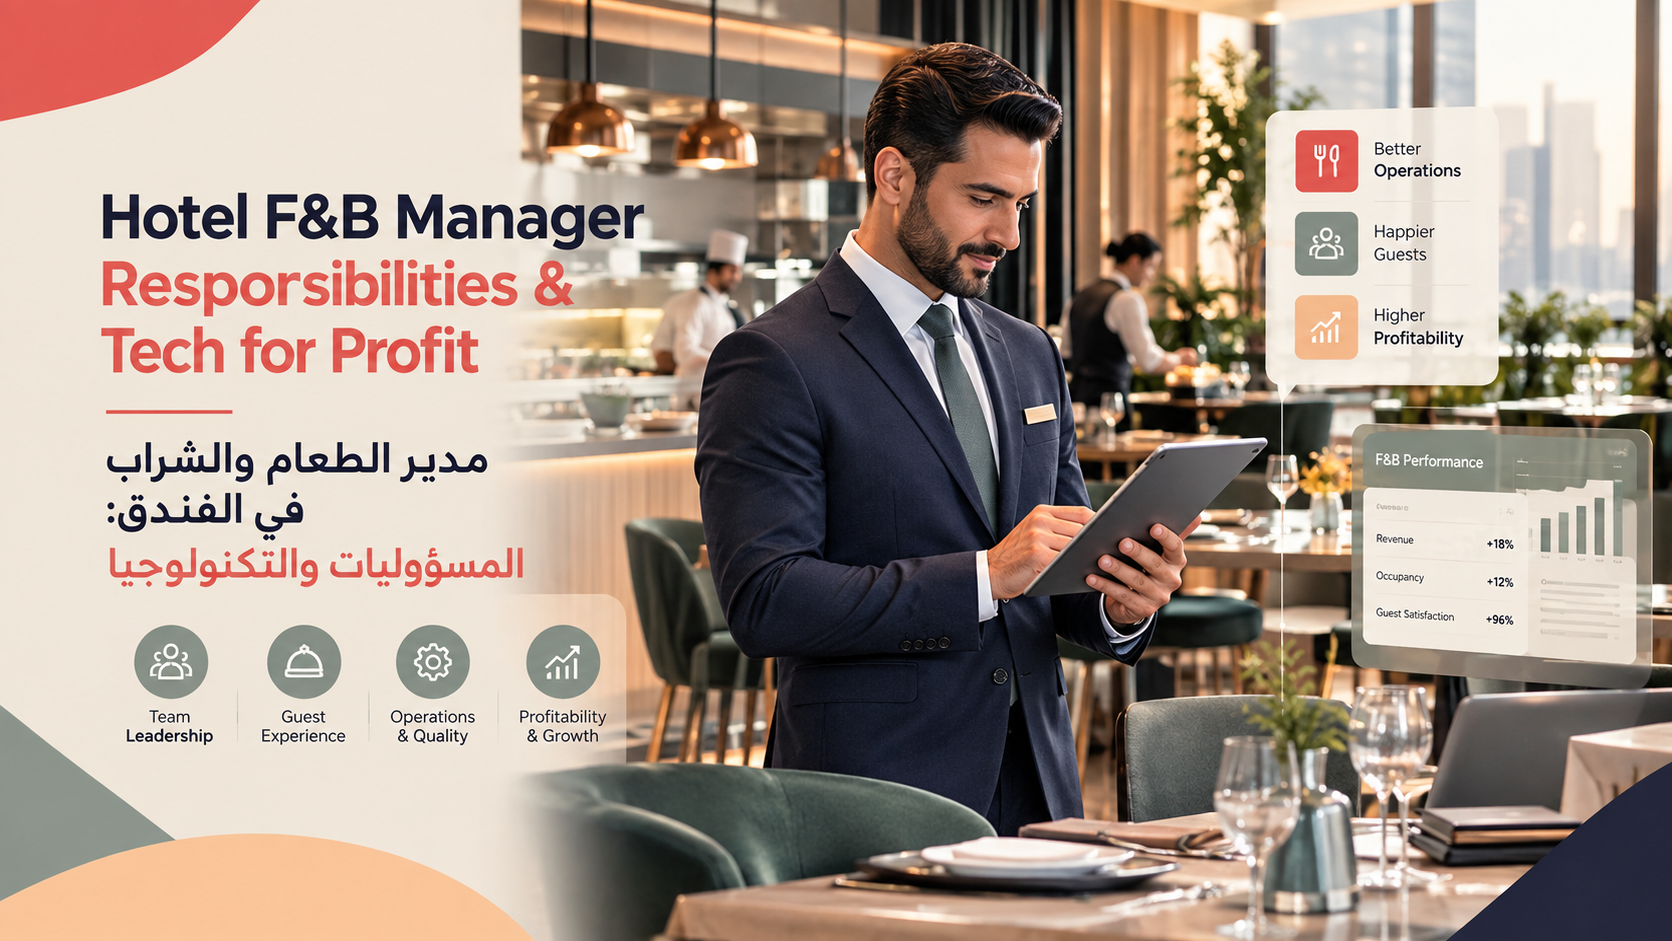
Complete guide to hotel food & beverage manager duties, food cost control, menu engineering, and how POS–PMS integration cuts waste and boosts profit in Saudi hotels....
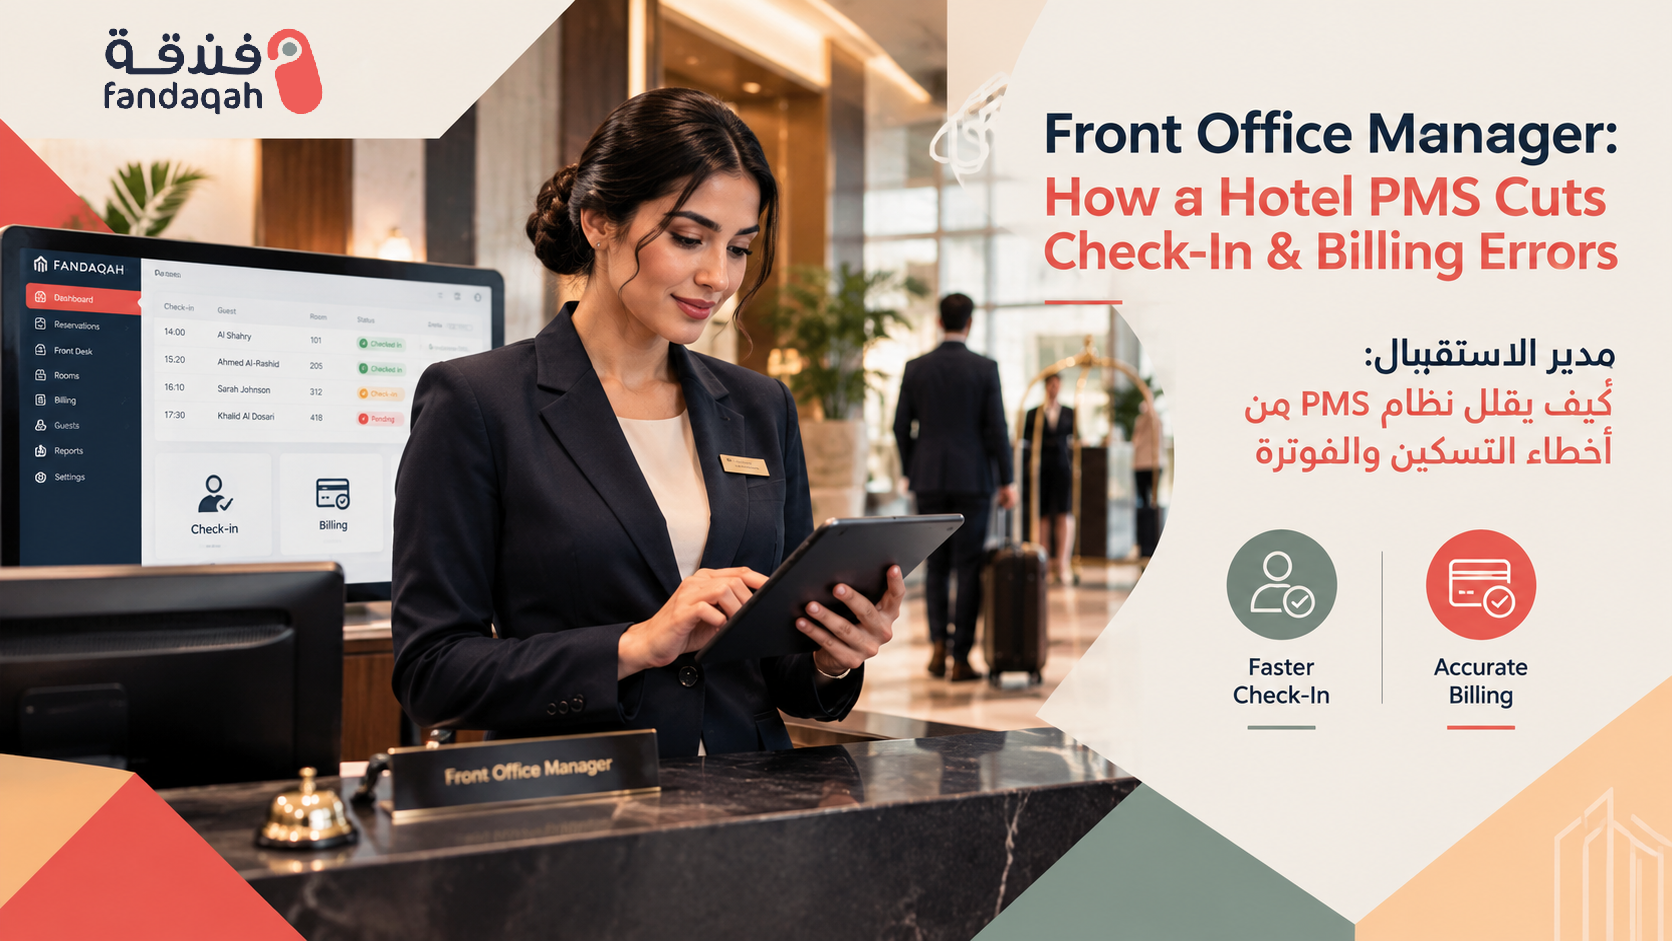
Discover how a hotel PMS eliminates double bookings, wrong room assignments, and billing mistakes in Saudi hotels. ZATCA-compliant, real-time, and built for Vision 2030....
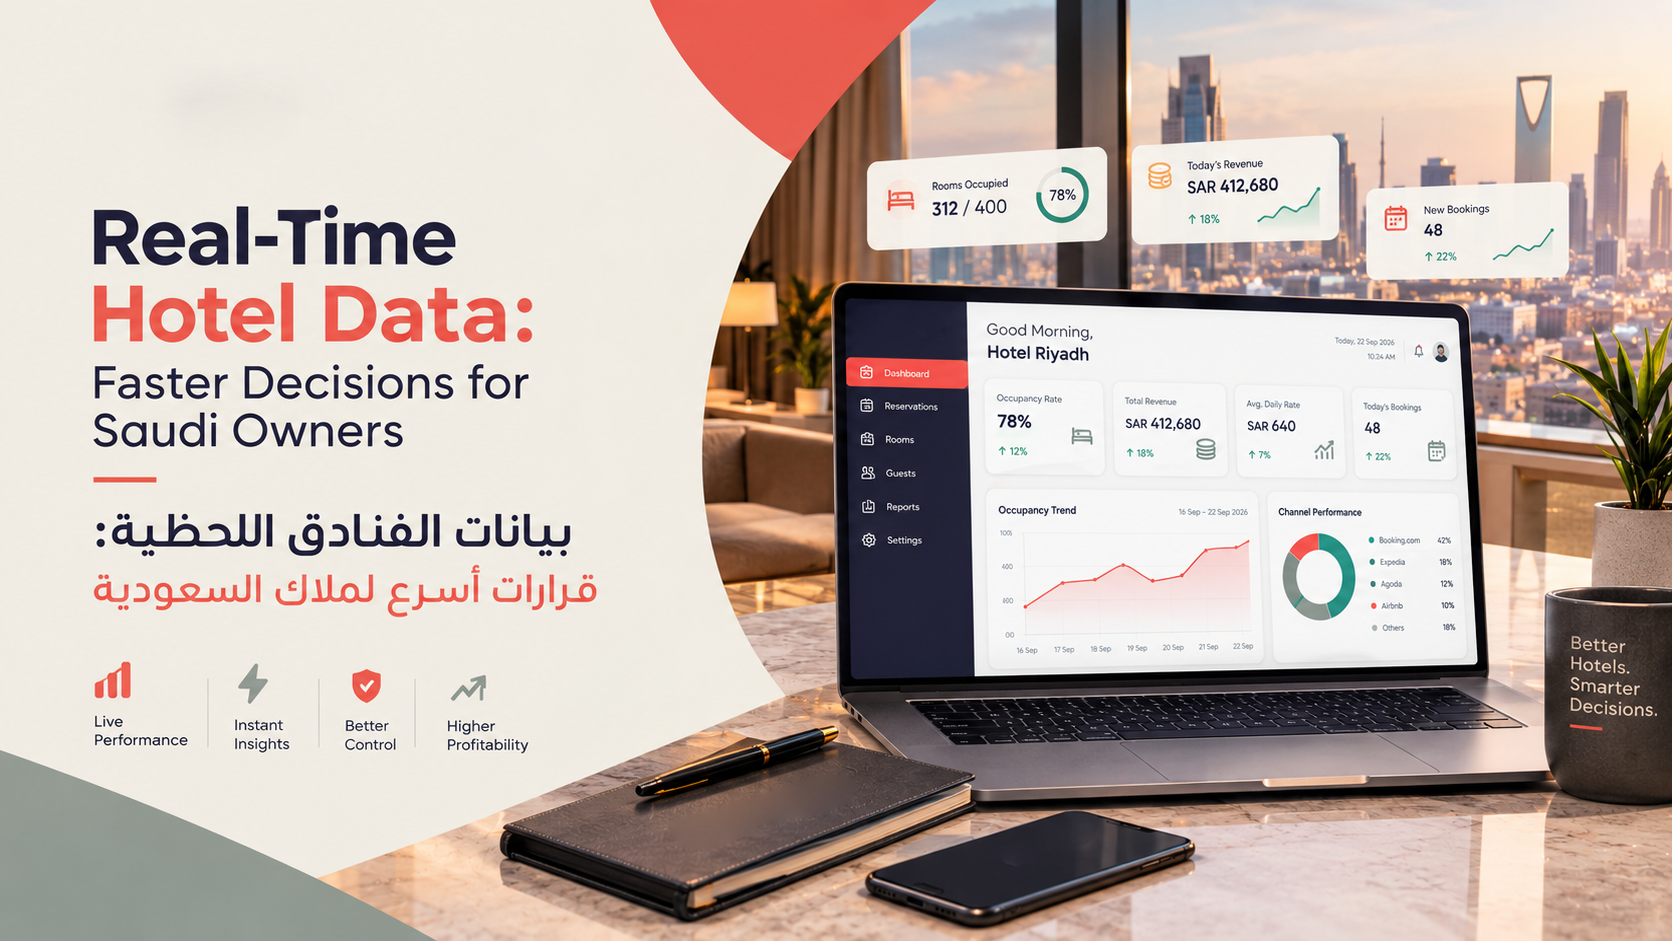
Discover how real-time hotel data helps owners boost RevPAR 5–15%, react to demand in minutes, and stay competitive in Saudi Arabia’s Vision 2030 tourism boom....
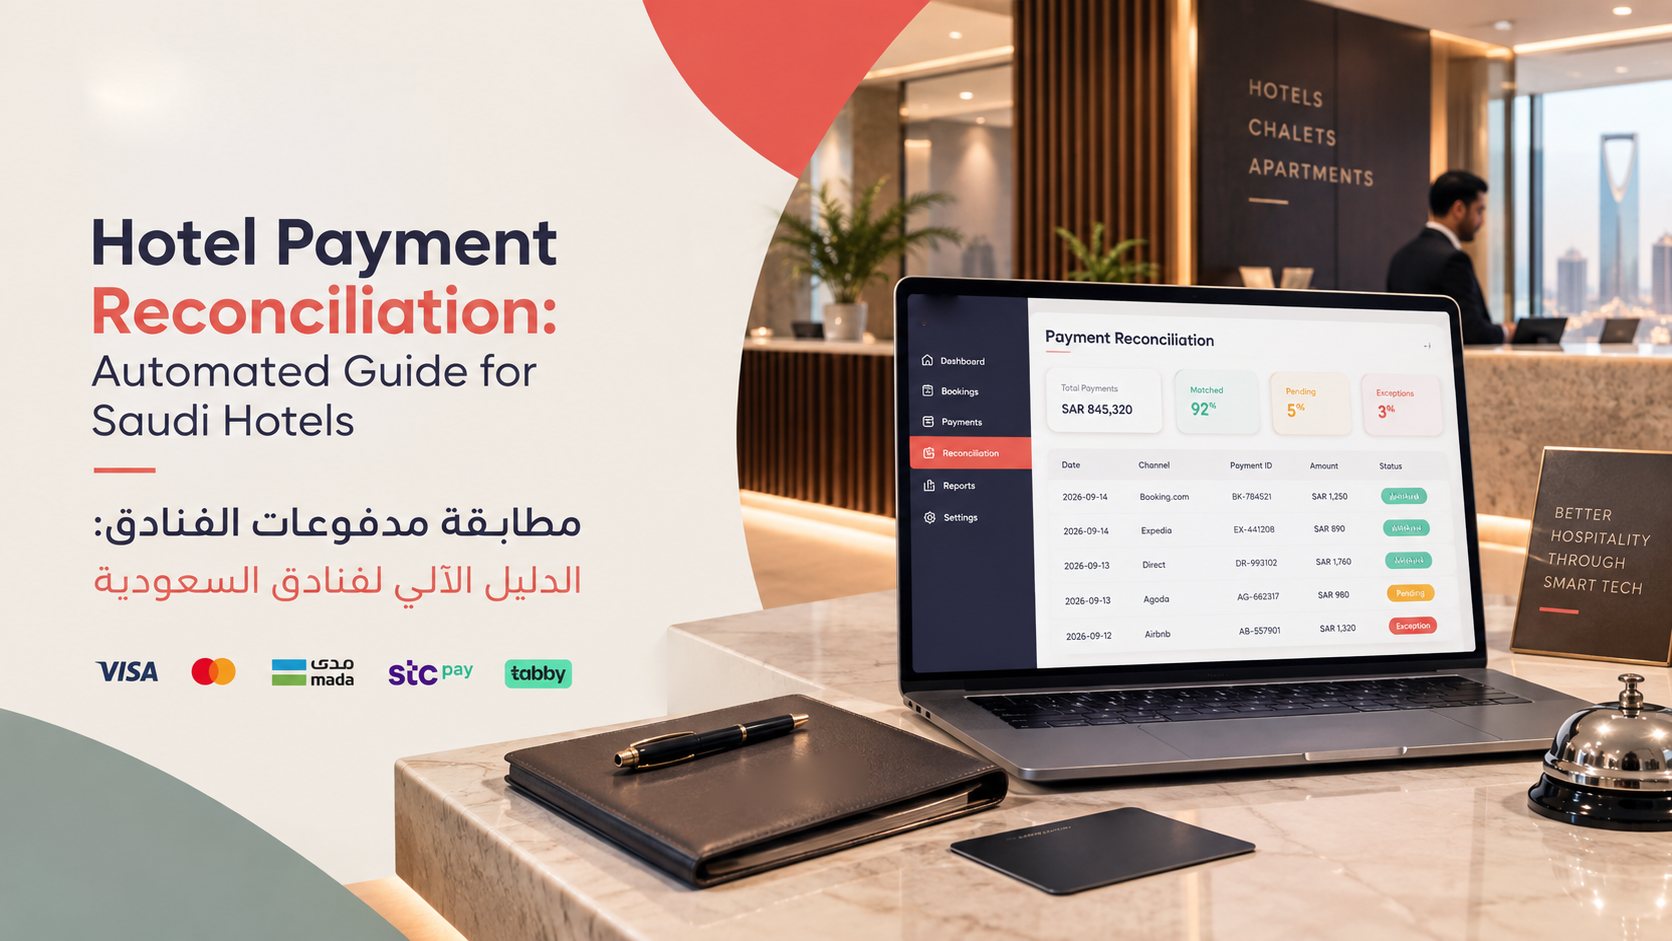
Learn how automated hotel payment reconciliation matches reservations, payments & invoices in real time. Recover revenue, cut time 80–90% & stay ZATCA-ready....
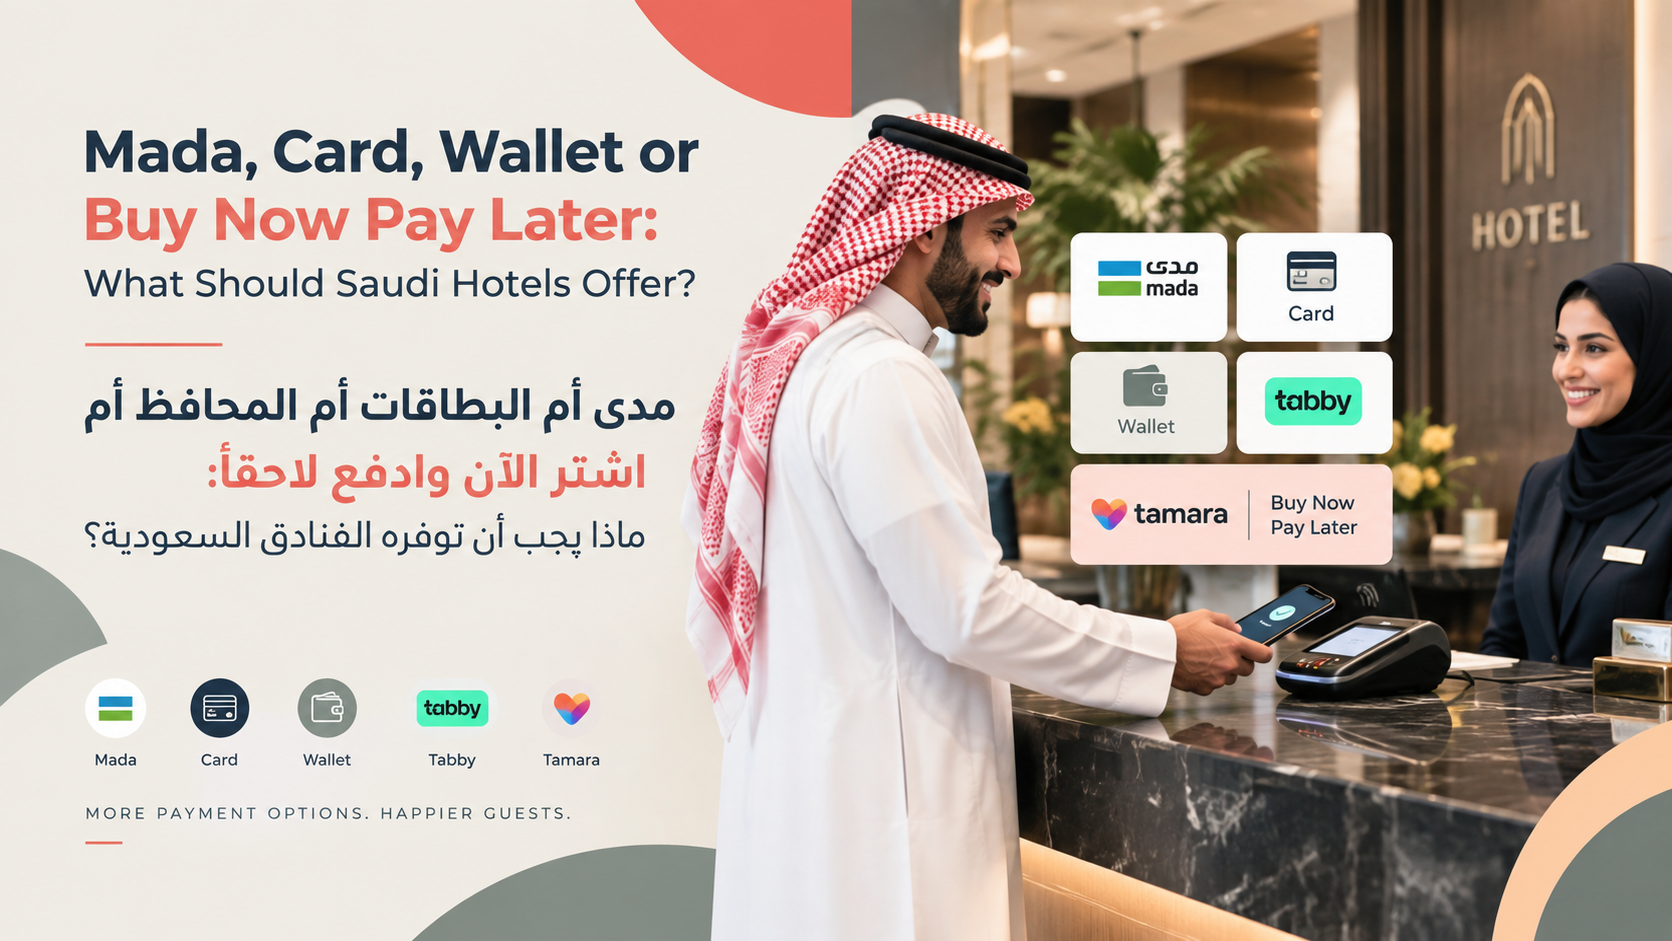
Complete 2026 guide: which payment methods Saudi hotels must offer — Mada, Visa/Mastercard, Apple Pay, Tabby & Tamara — to boost direct bookings and margins....

Learn how Saudi hotel owners can build a single source of truth for property performance. Cut reporting time 70–90%, track RevPAR, ADR & occupancy in real time....
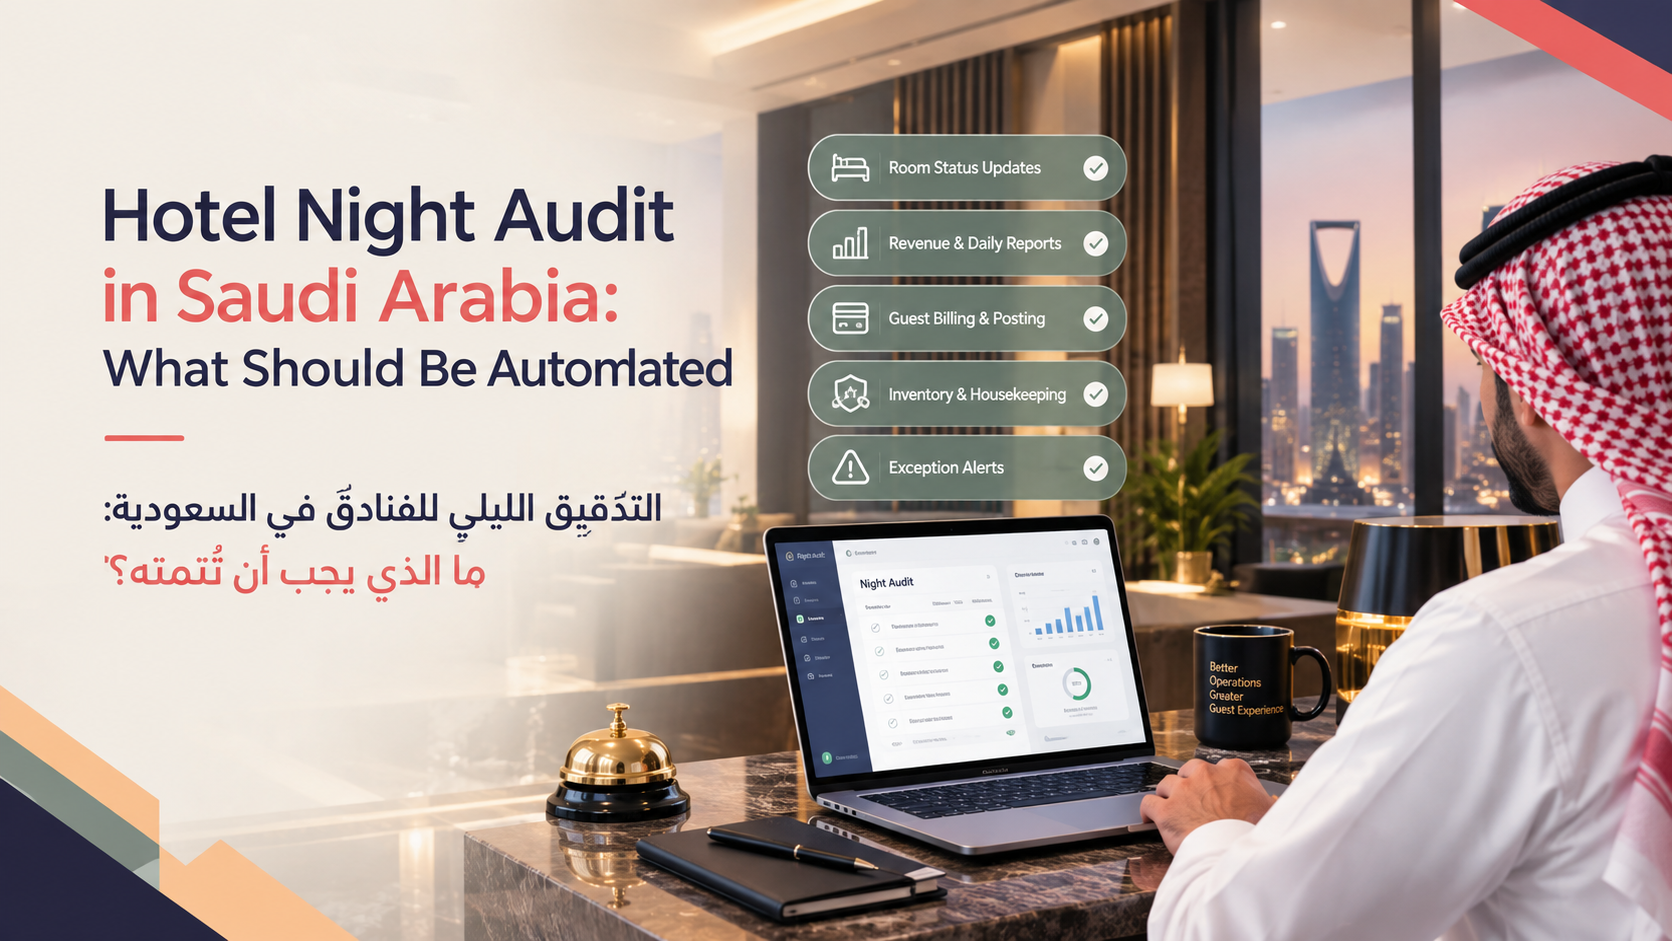
Complete guide to automating hotel night audit in Saudi Arabia: room & tax posting, no-shows, ZATCA Fatoora e-invoicing, payment reconciliation & continuous close....

Discover proven strategies for Saudi hotels to protect revenue in low occupancy: dynamic pricing, RevPAR & TRevPAR focus, direct bookings, ancillary income, staycations & Vision 2030 insights....
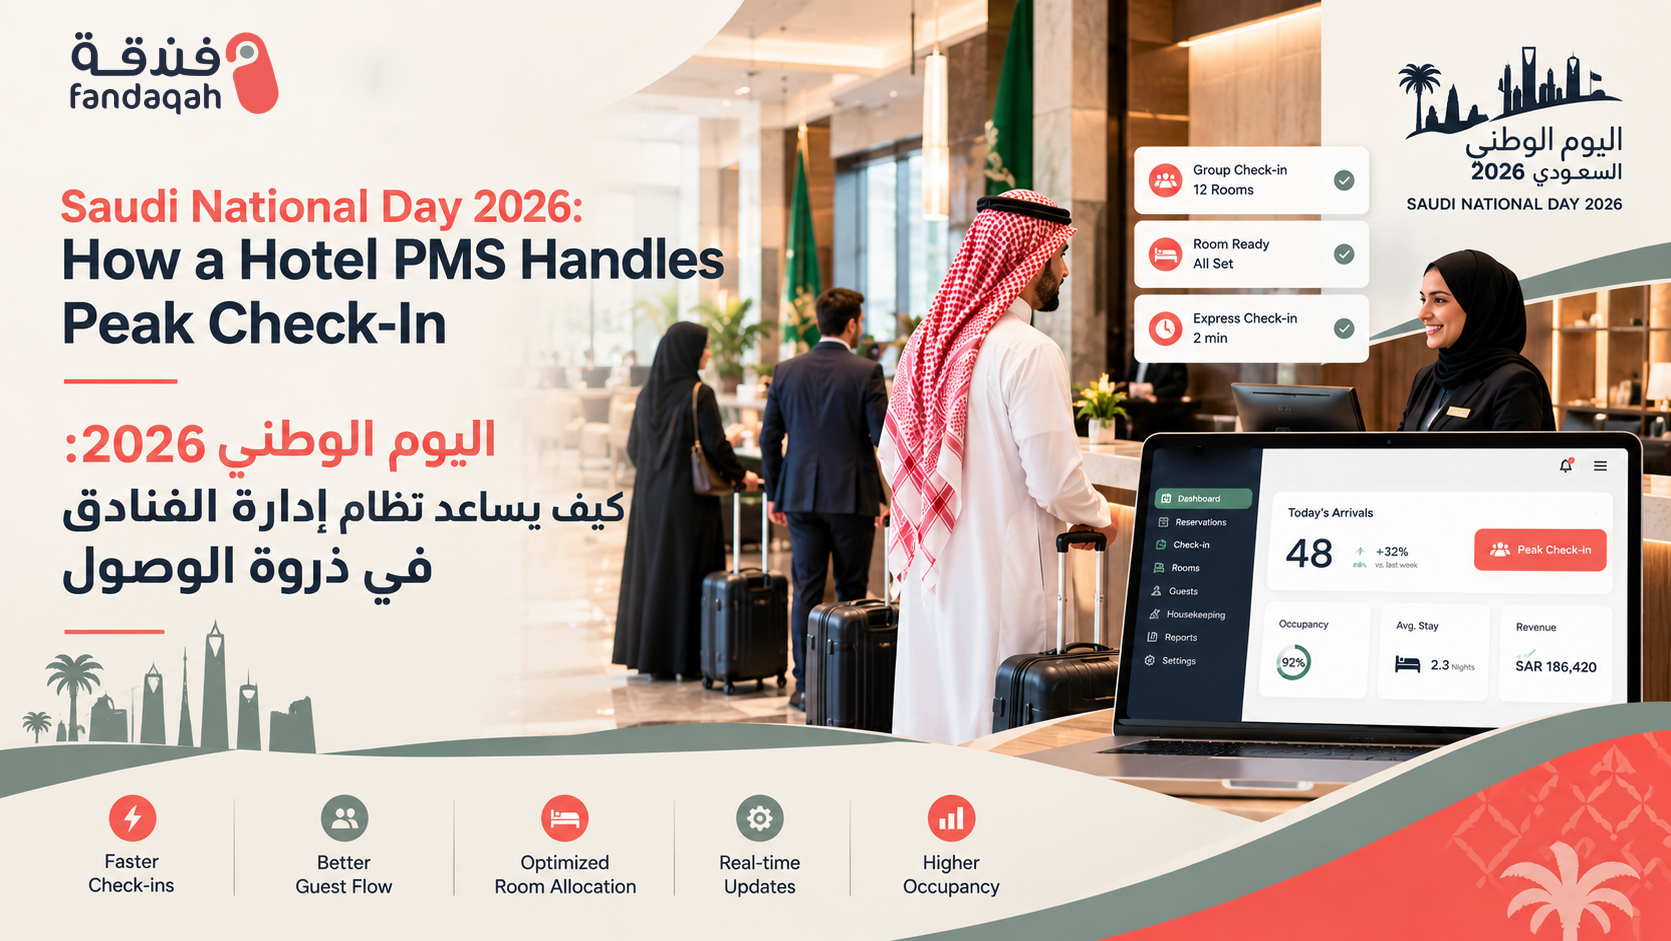
A hotel management system (PMS) cuts queues on Saudi National Day 2026 with pre-check-in, auto room assignment, live housekeeping, channel sync and instant e-invoices. Shorter waits, zero overbookings...
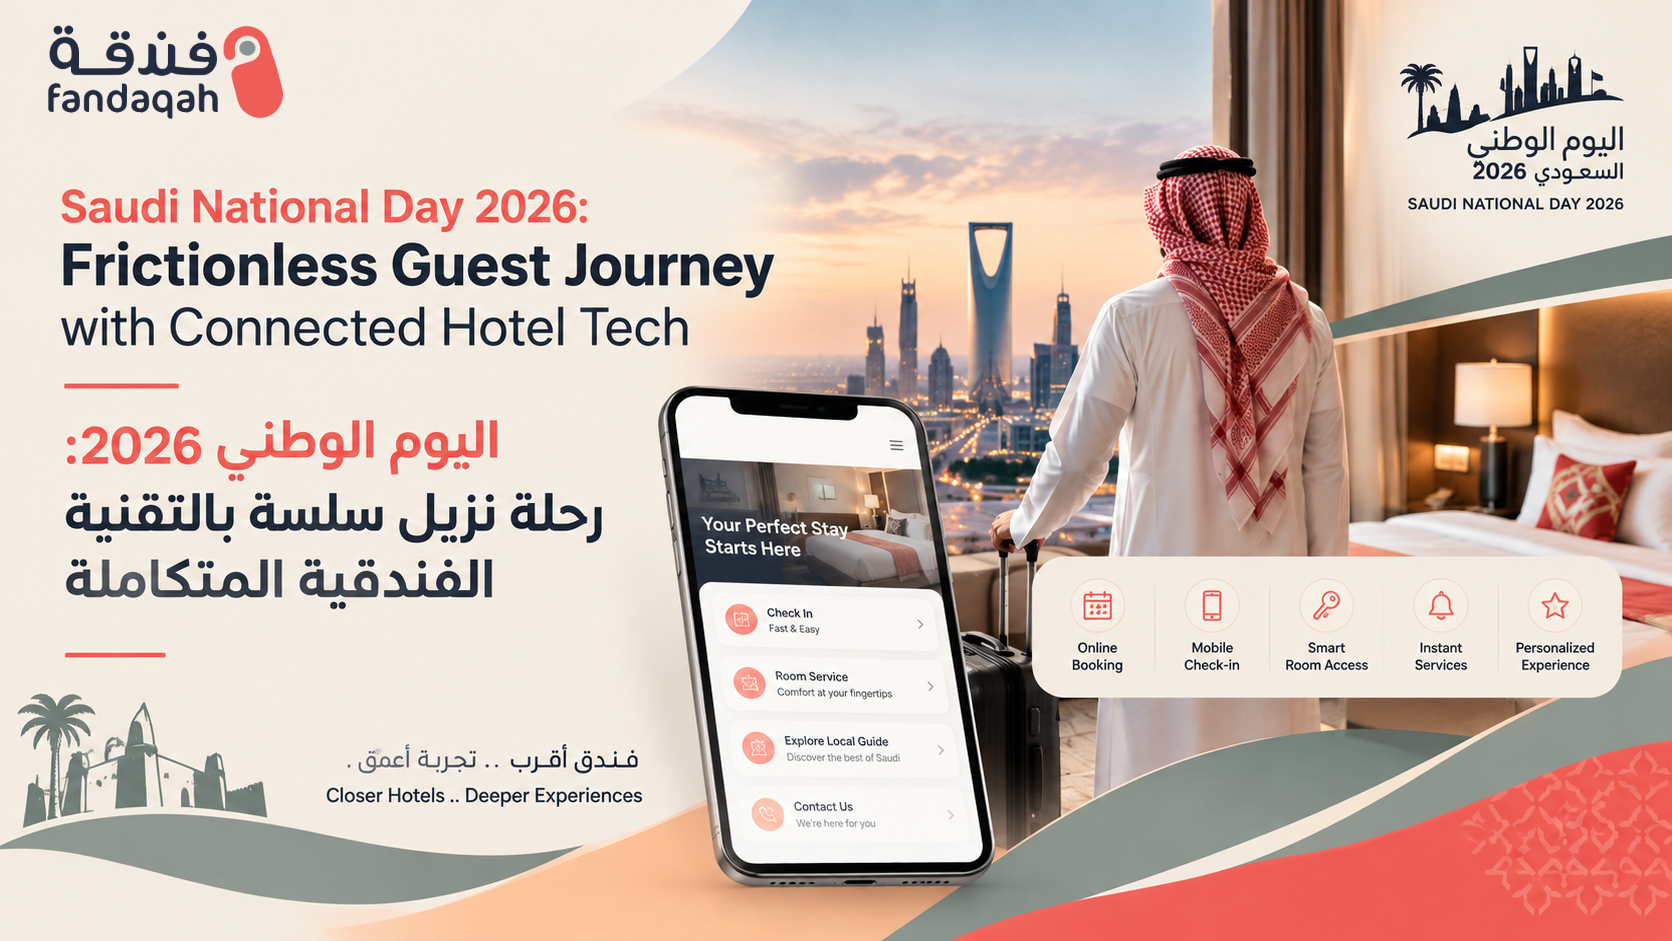
Connected hotel technology creates a seamless guest journey for Saudi National Day 2026. Link PMS, booking engine, POS, mobile keys & more—enter data once, zero friction from search to review....

12 proven strategies to increase direct hotel bookings in Saudi Arabia. Grow commission-free revenue with booking engines, WhatsApp, Google Free Booking Links & more in 2026....
Learn proven strategies to reduce OTA commissions, boost direct bookings, and increase hotel profits in Saudi Arabia. Practical tips for Riyadh, Jeddah, Makkah & more in 2026....
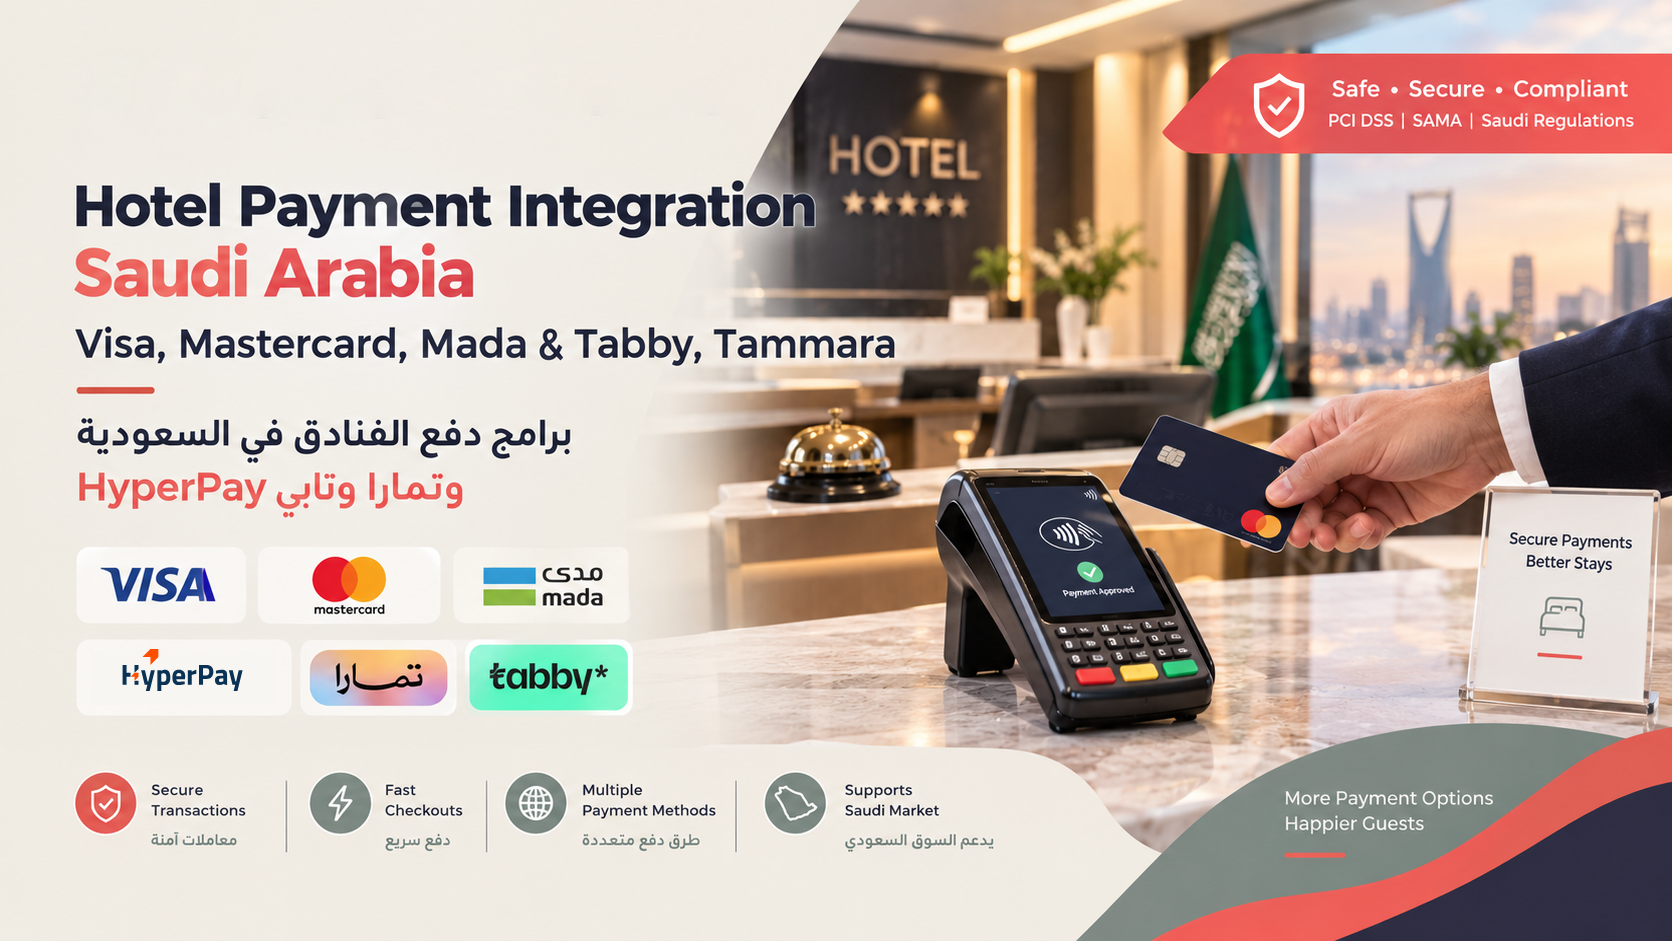
How Fandaqah integrates HyperPay, mada, Visa, Apple Pay, Tamara and Tabby for secure direct hotel payments in Saudi Arabia — with ZATCA invoicing built in....
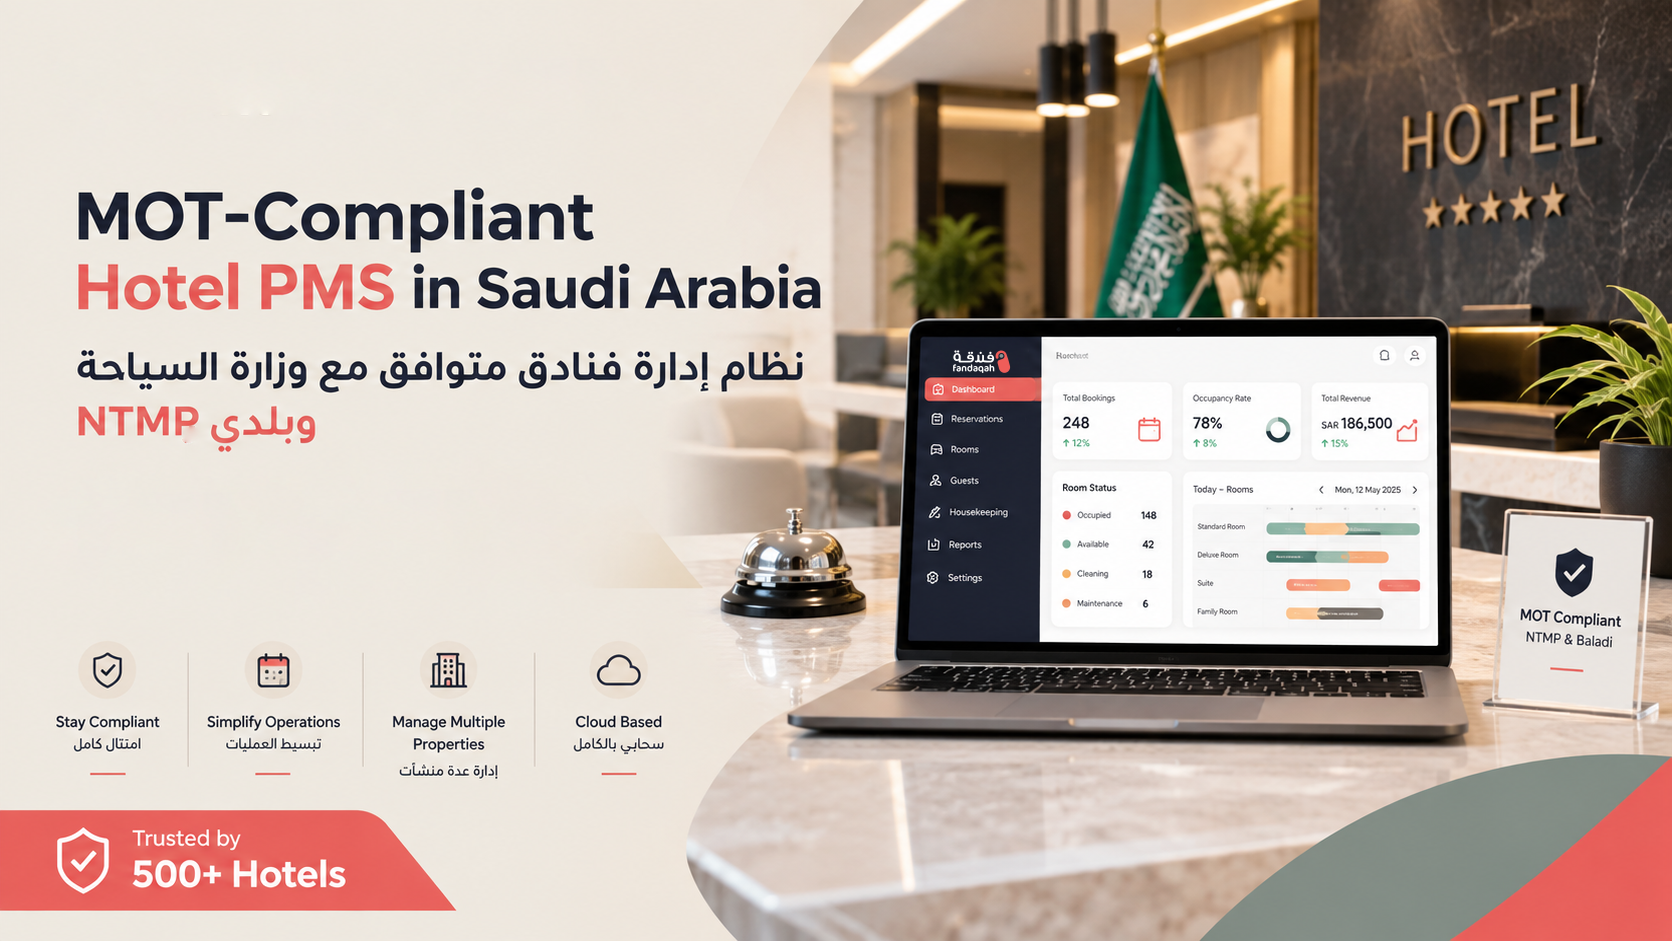
Practical guide to MOT-compliant hotel PMS in Saudi Arabia. Cover NTMP reporting, guest registration, Baladi licences, ZATCA invoicing and how Fandaqah helps....
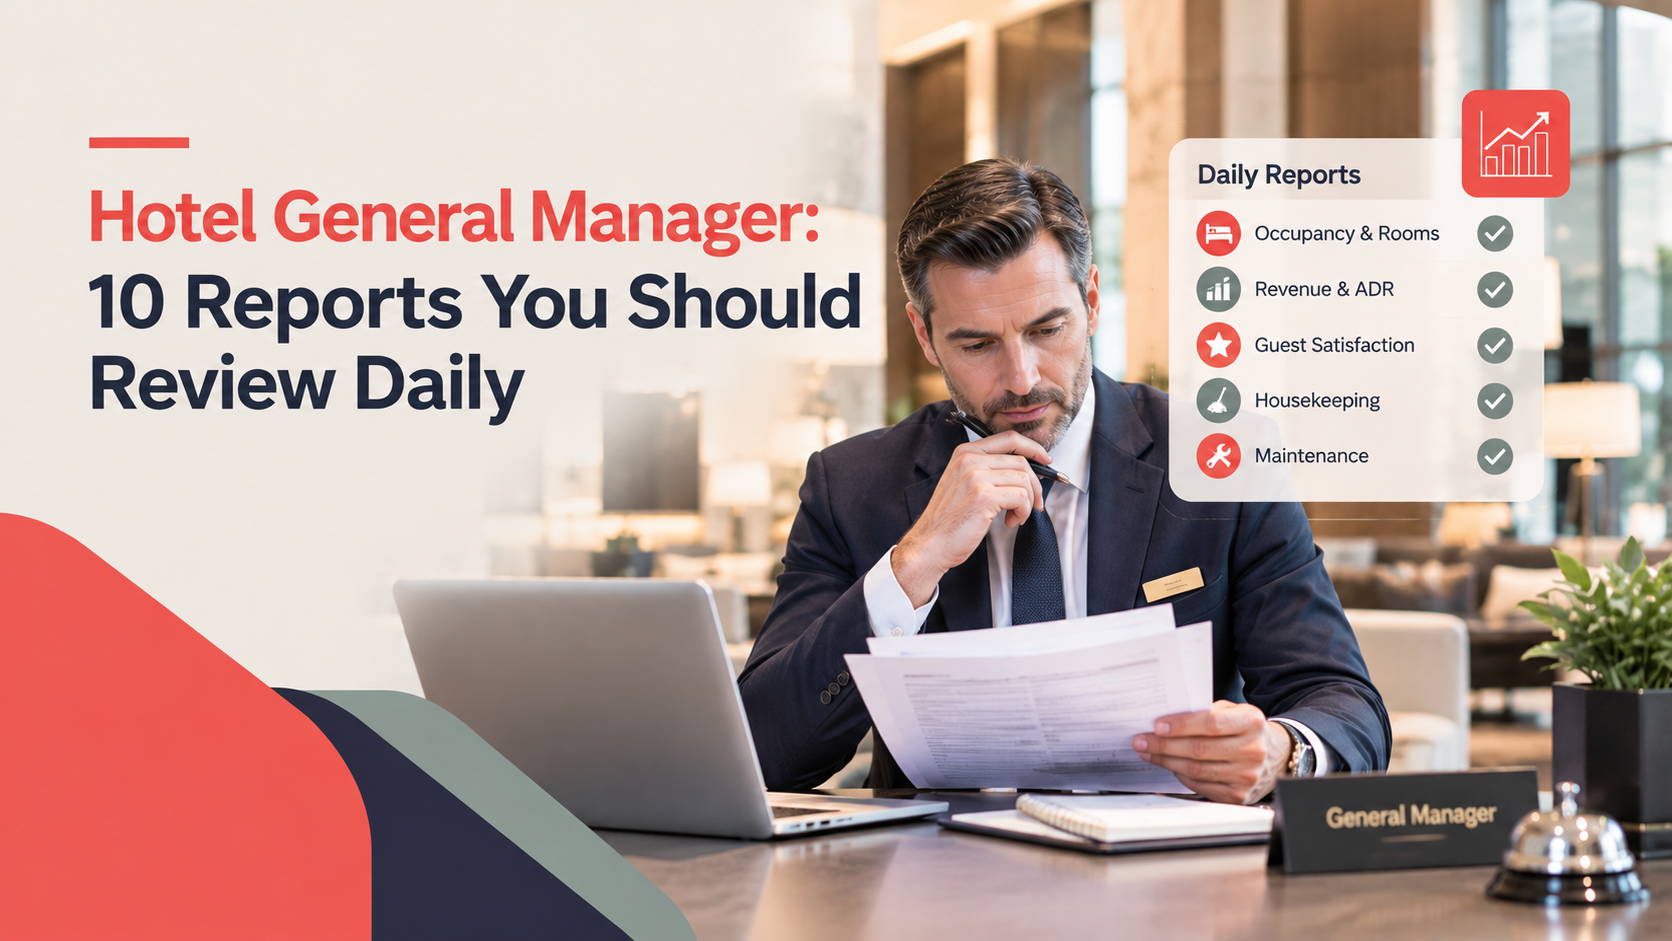
The 10 essential daily hotel reports every general manager should review before 10 a.m.: flash, night audit, ADR & RevPAR, pace, room status, and more — with red flags to watch....
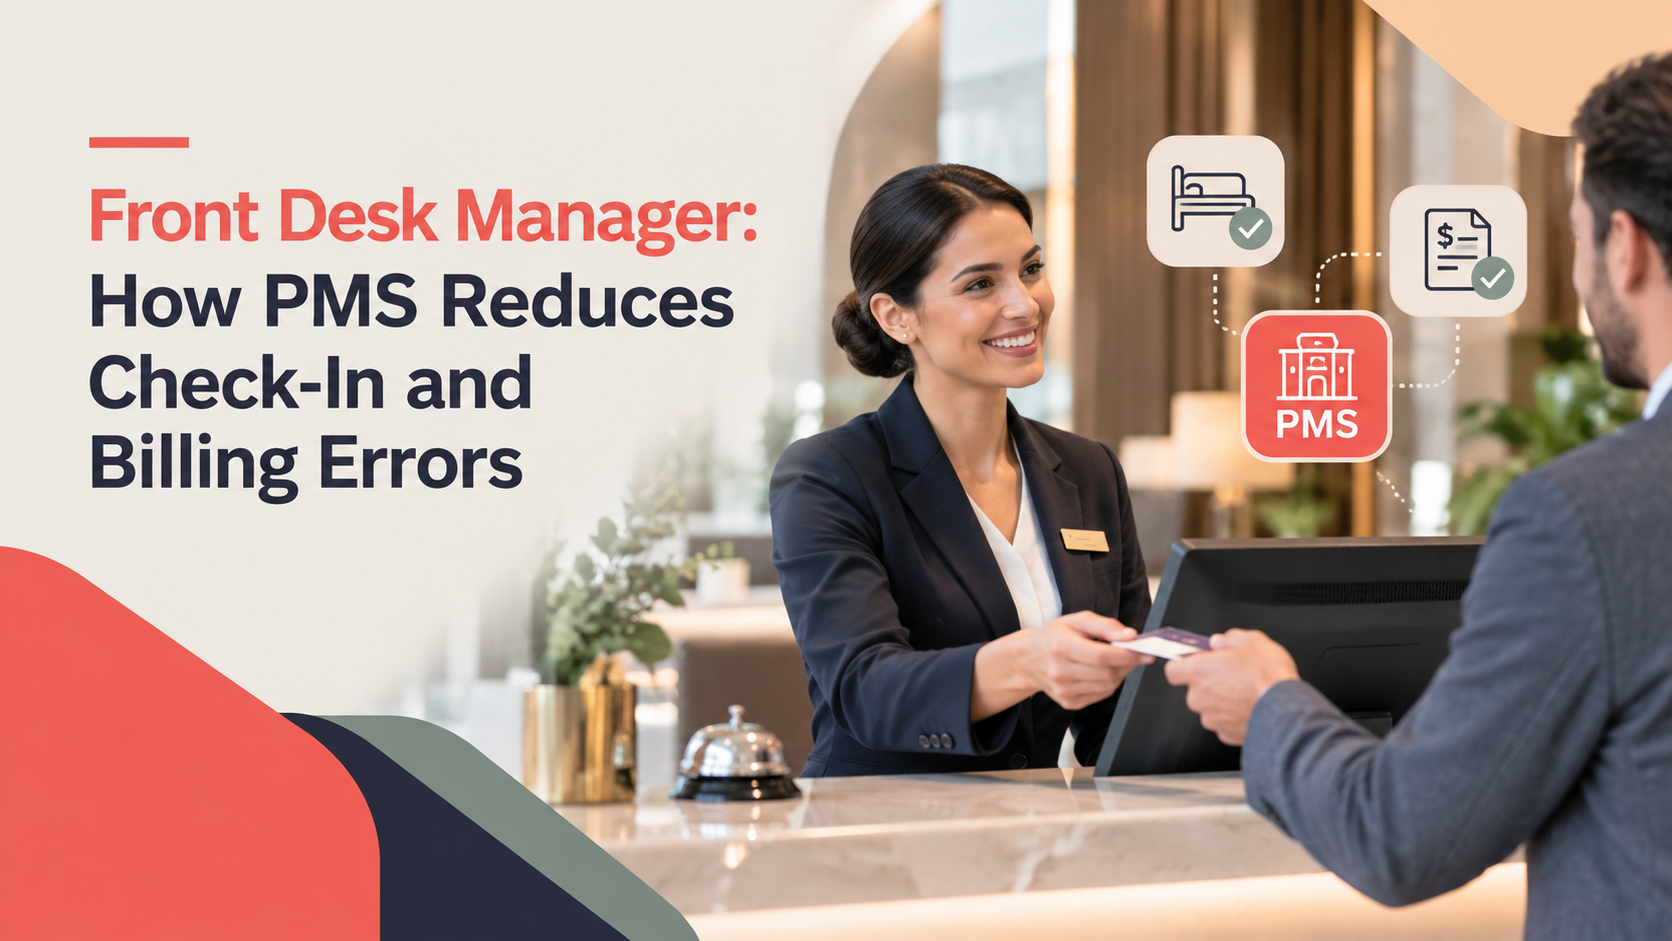
Discover how a hotel PMS cuts front-desk check-in and billing errors with live room status, channel sync, auto POS posting, and ZATCA e-invoicing for Saudi properties....

How hotel sales managers in Saudi Arabia win corporate rate agreements and MICE contracts. Practical RFP tips, smart pricing, account targeting and sales KPIs....
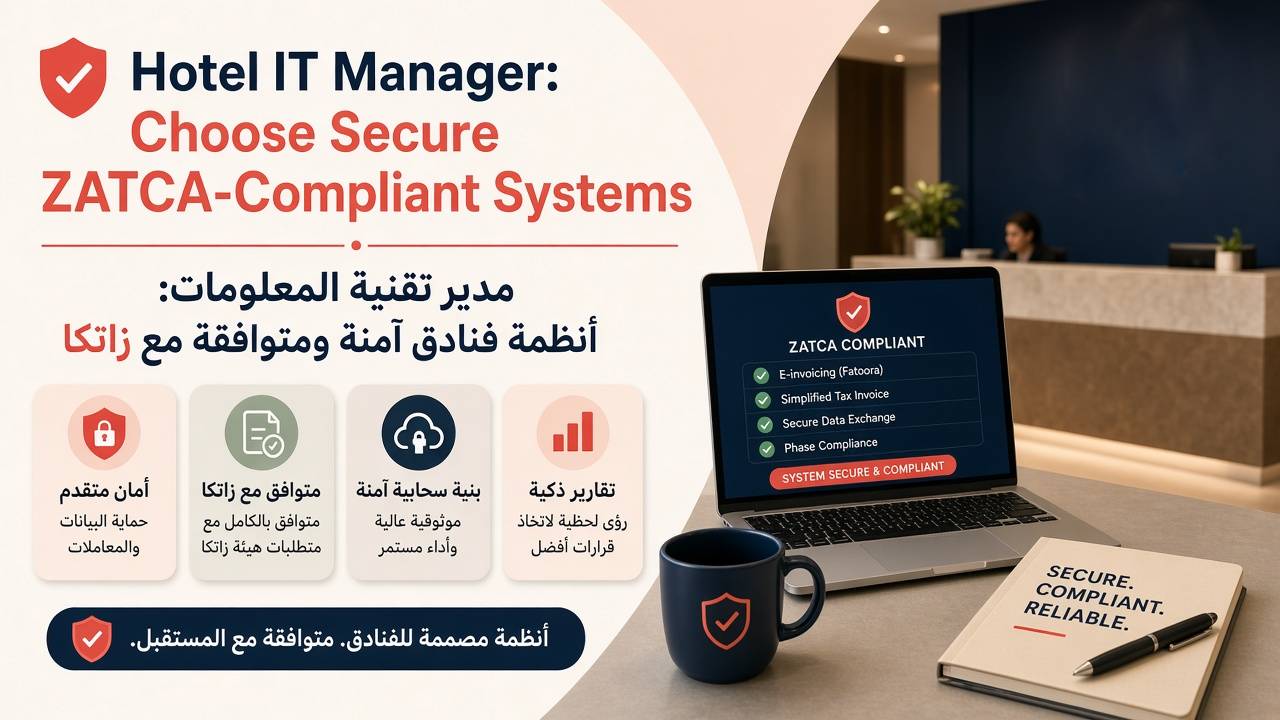
How hotel IT managers in Saudi Arabia select secure, ZATCA Phase 2-compliant PMS systems. Checklist for e-invoicing, Fatoora integration, PDPL & guest data protection....
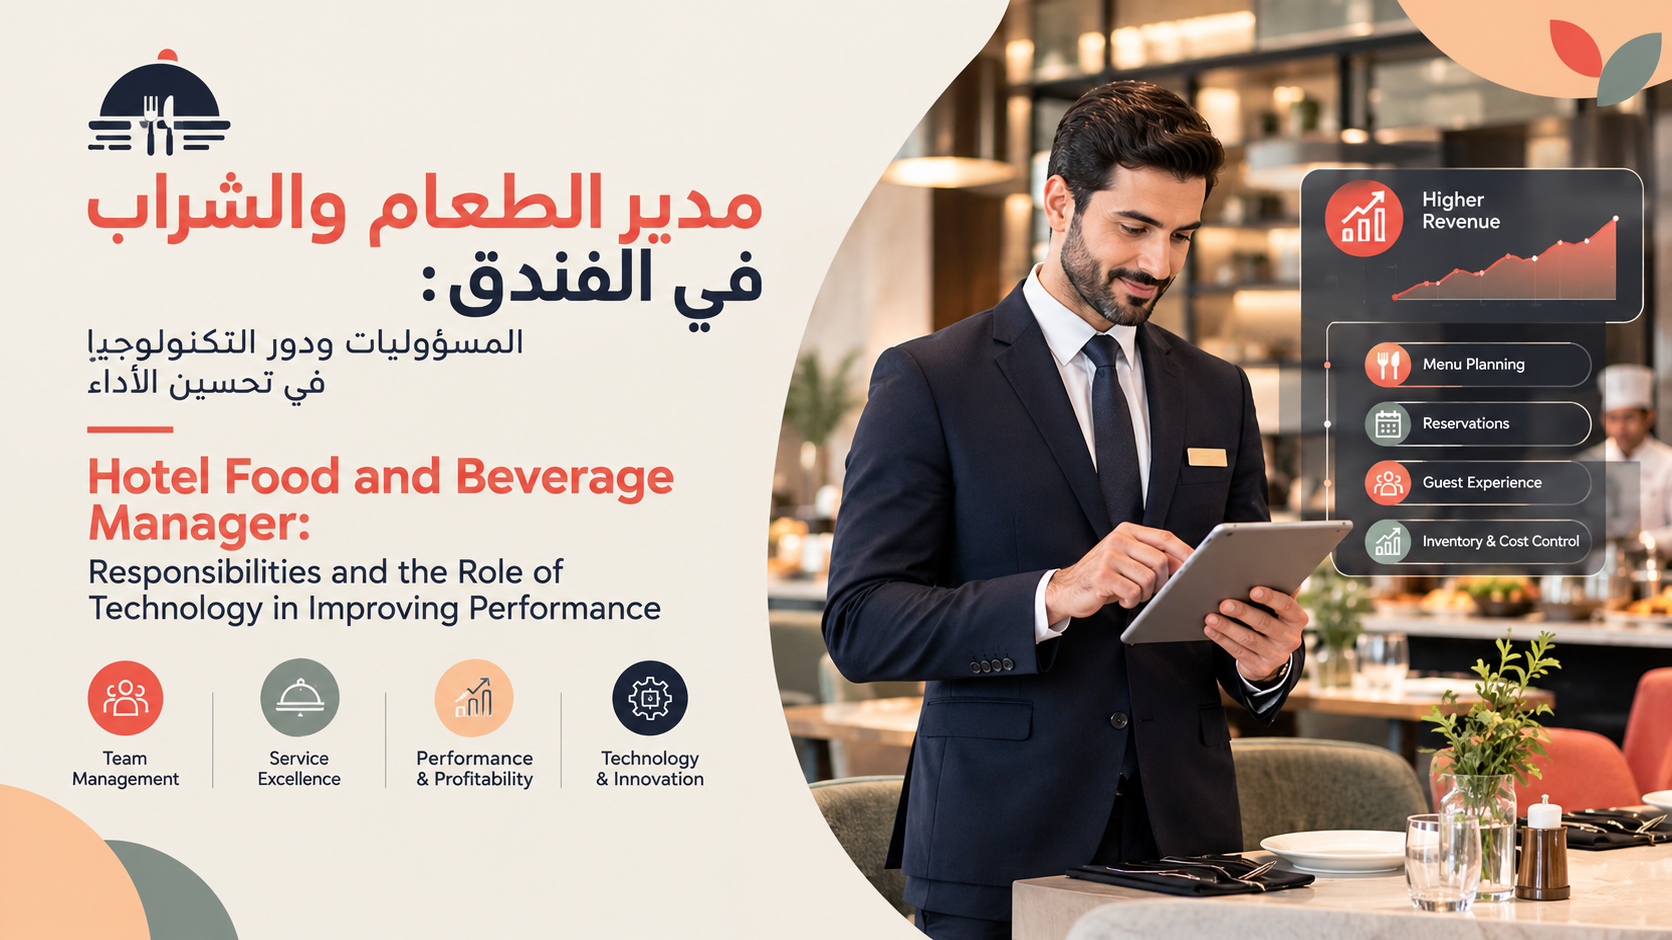
Discover the hotel food and beverage manager’s real duties, key KPIs (food cost %, average check, waste), and how POS-PMS integration cuts costs and raises profit in Saudi hotels....
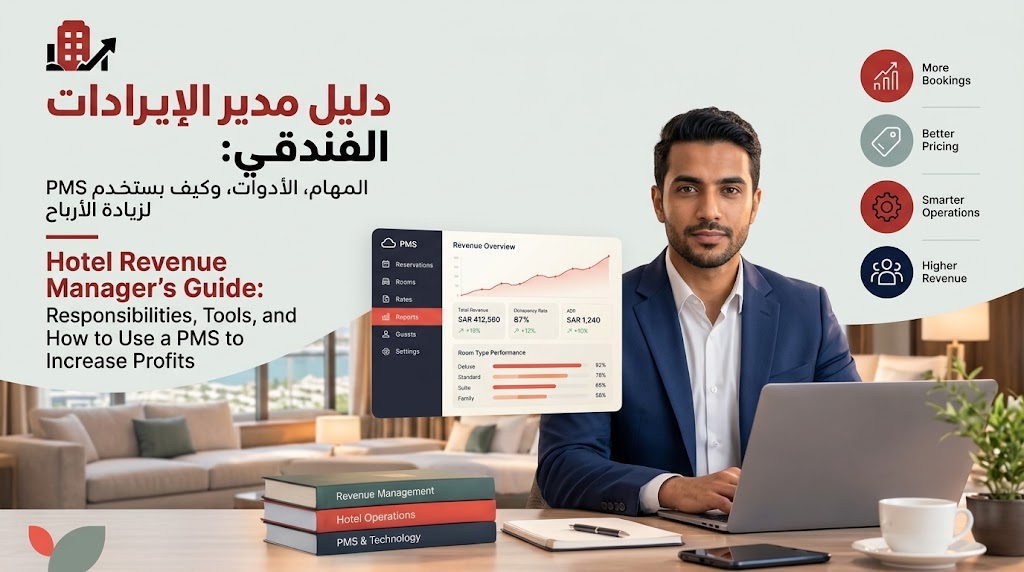
Learn what a hotel revenue manager does daily, the KPIs that matter (RevPAR, ADR, GOPPAR), and 8 practical ways to use a PMS to raise profits in the Saudi market....

Design a frictionless guest journey in 7 stages. Map friction points, apply 5 principles, cut check-in time, and connect bookings to billing with one PMS. Practical guide for Saudi hotels and serviced...
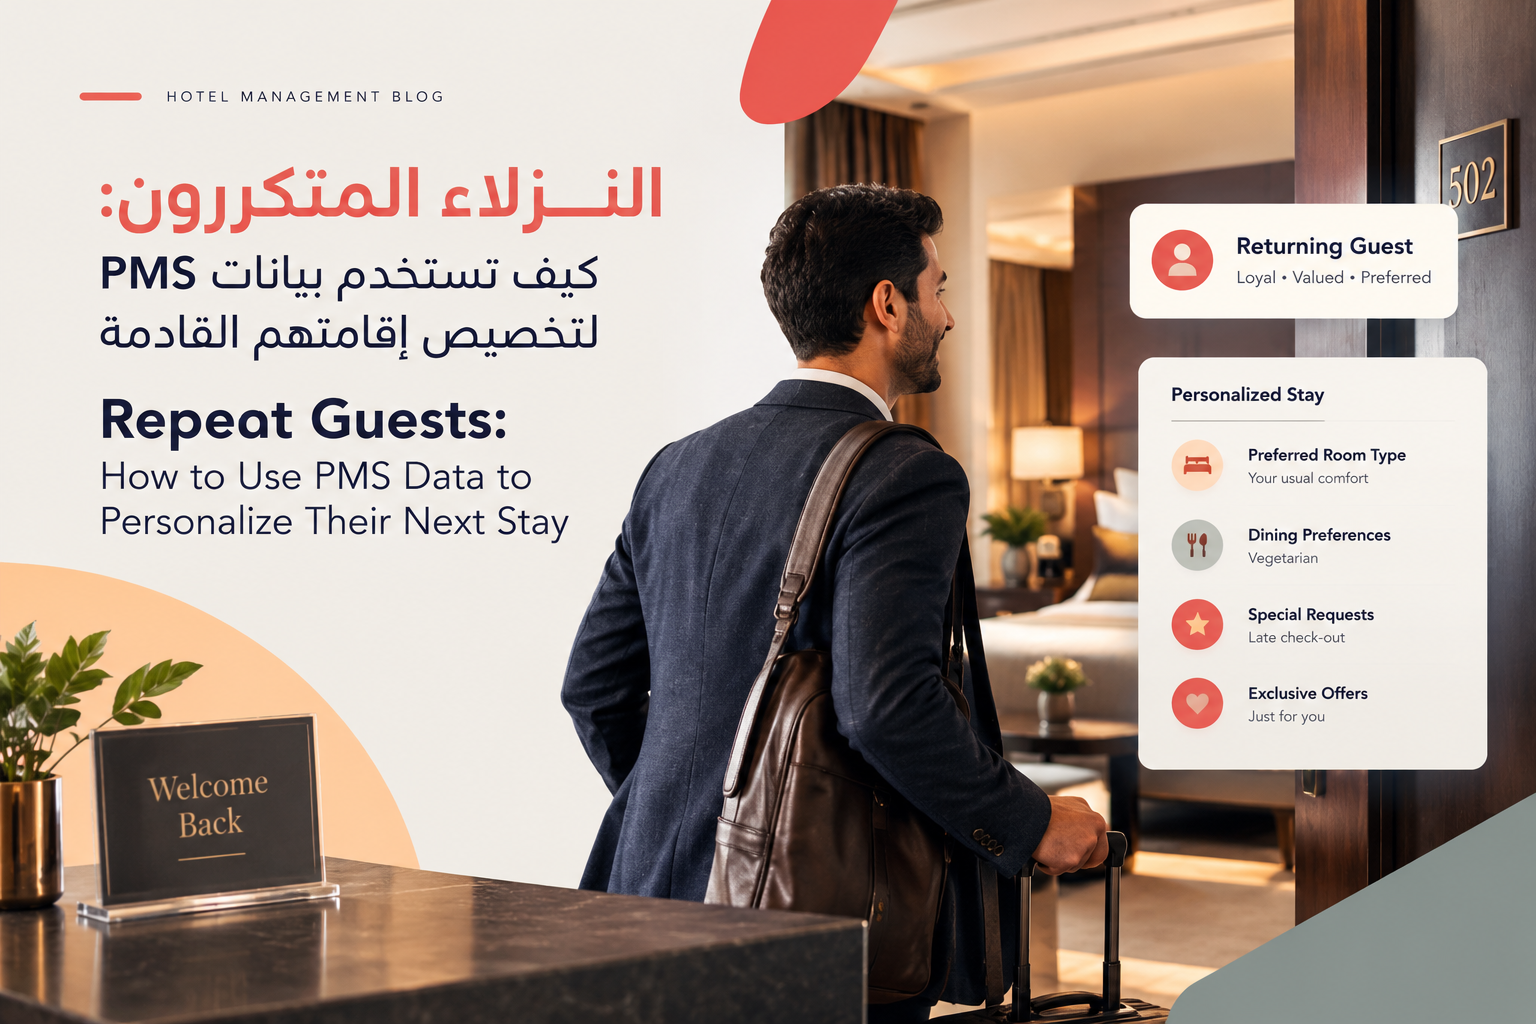
Turn PMS data into personalized stays for repeat guests. 5-step framework: unify profiles, segment, tag preferences, activate at 3 moments, and measure results. Built for Saudi hotels & serviced apart...
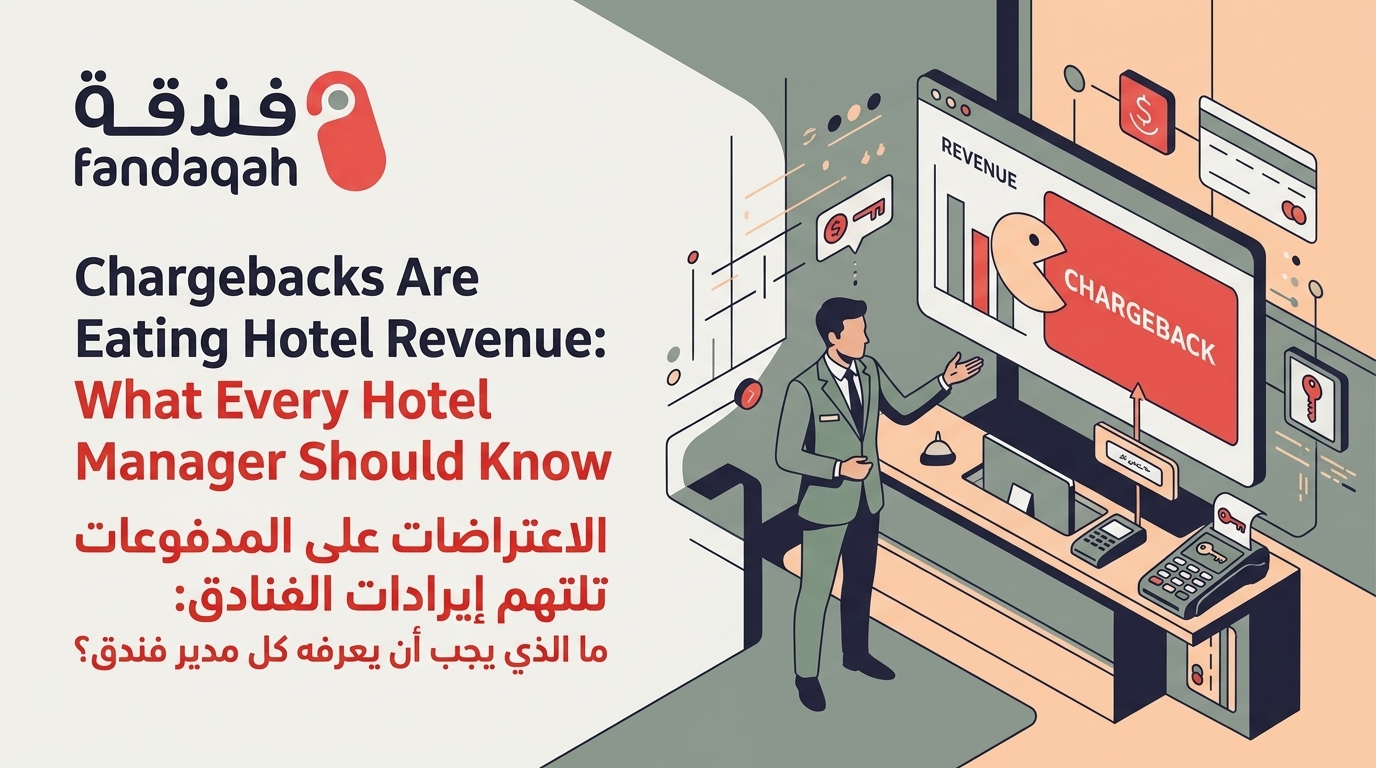
Is your hotel battling rising chargebacks? Discover why chargebacks are eating into hotel revenue and learn essential strategies to prevent, dispute, and protect your bottom line from fraudulent claim...
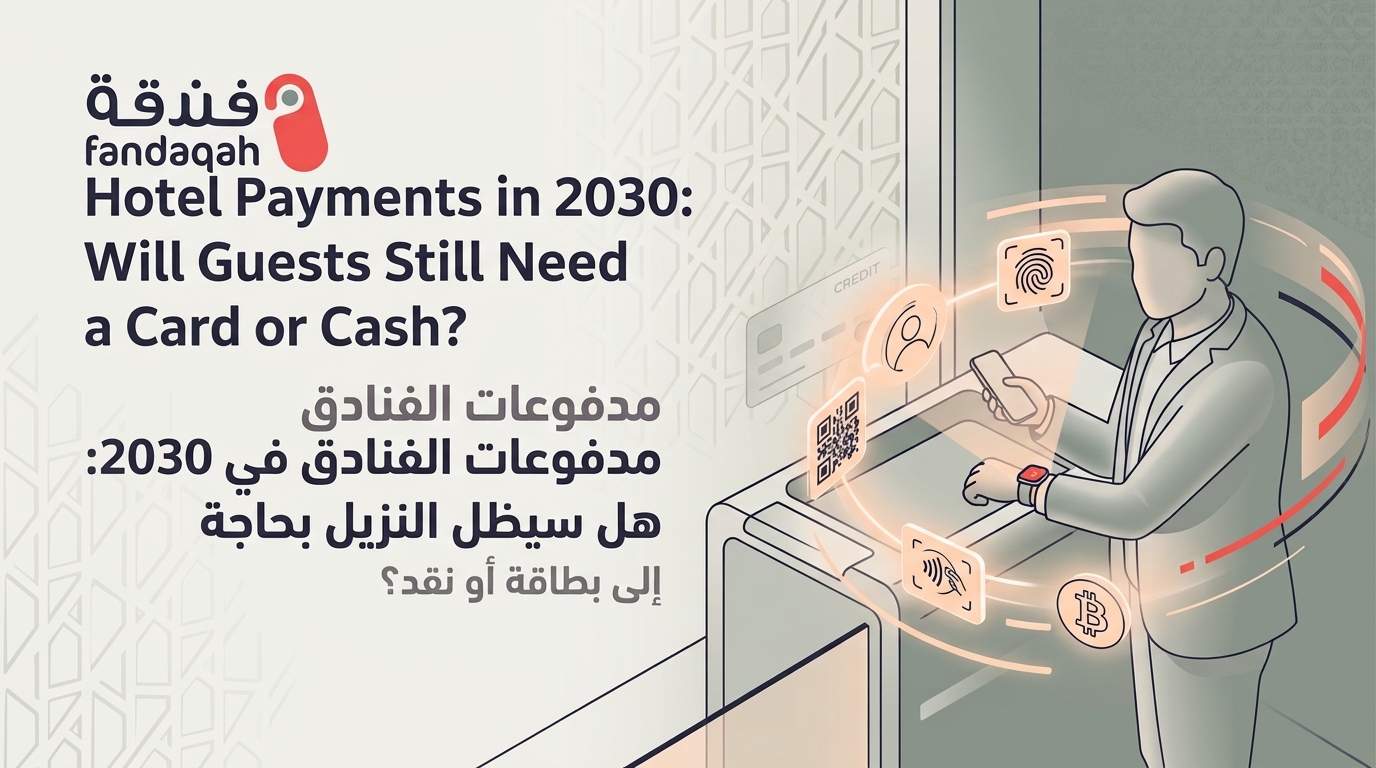
By 2030, hotel payment landscapes will be unrecognizable. Explore how biometrics, digital wallets, and blockchain are set to redefine the guest experience, moving beyond traditional cards and cash for...
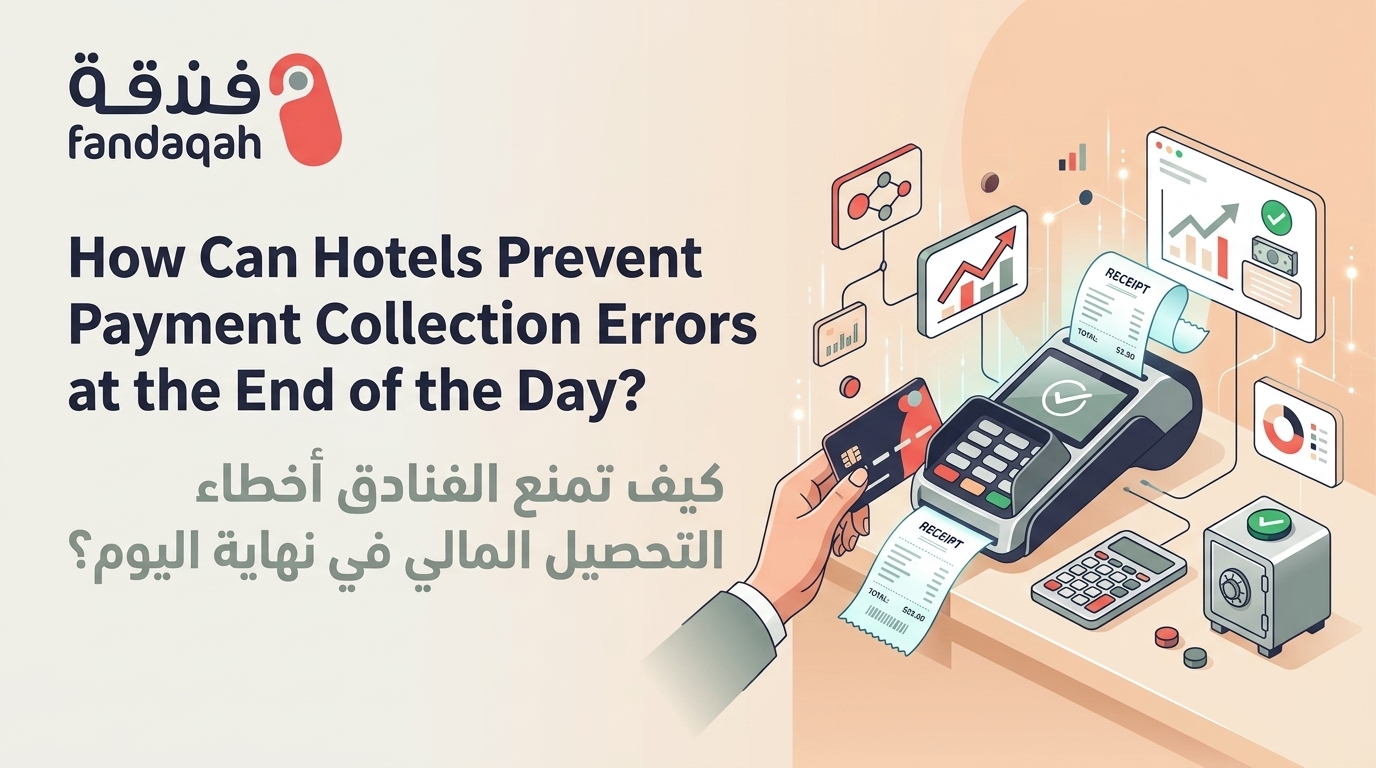
Prevent payment collection errors and streamline your hotel's end-of-day operations. Discover expert strategies, technology solutions, and best practices to ensure accurate financial reconciliation an...
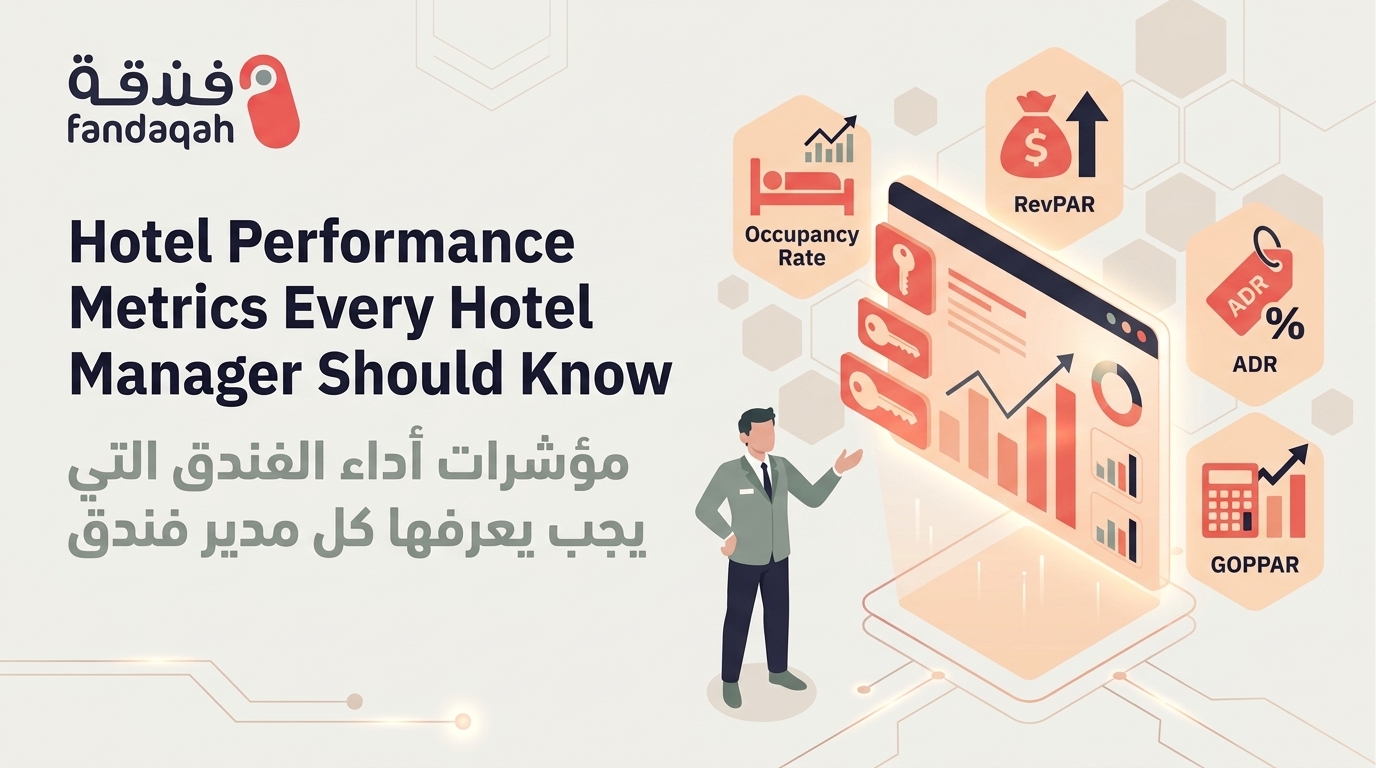
Unlock hotel success with key performance indicators. Learn the essential metrics like RevPAR, ADR, Occupancy, GOPPAR, and more that every hotel manager needs to master for profitability and growth....

Unlock the secrets to boosting your hotel's direct bookings. This expert guide provides actionable strategies, from enhancing your online presence to personalizing guest experiences, all without compr...
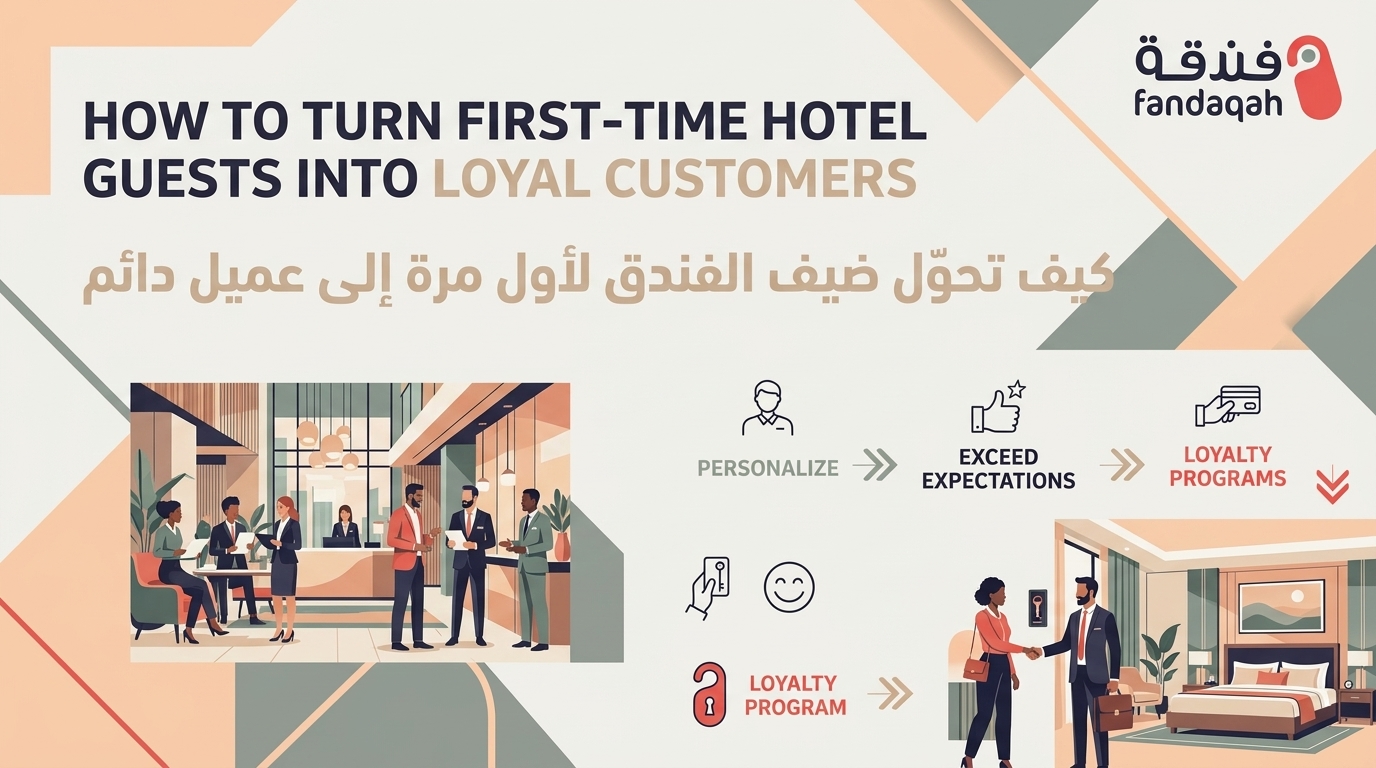
Unlock the secrets to transforming first-time hotel guests into lifelong advocates. Discover actionable strategies for exceptional service, personalized experiences, and powerful loyalty programs that...
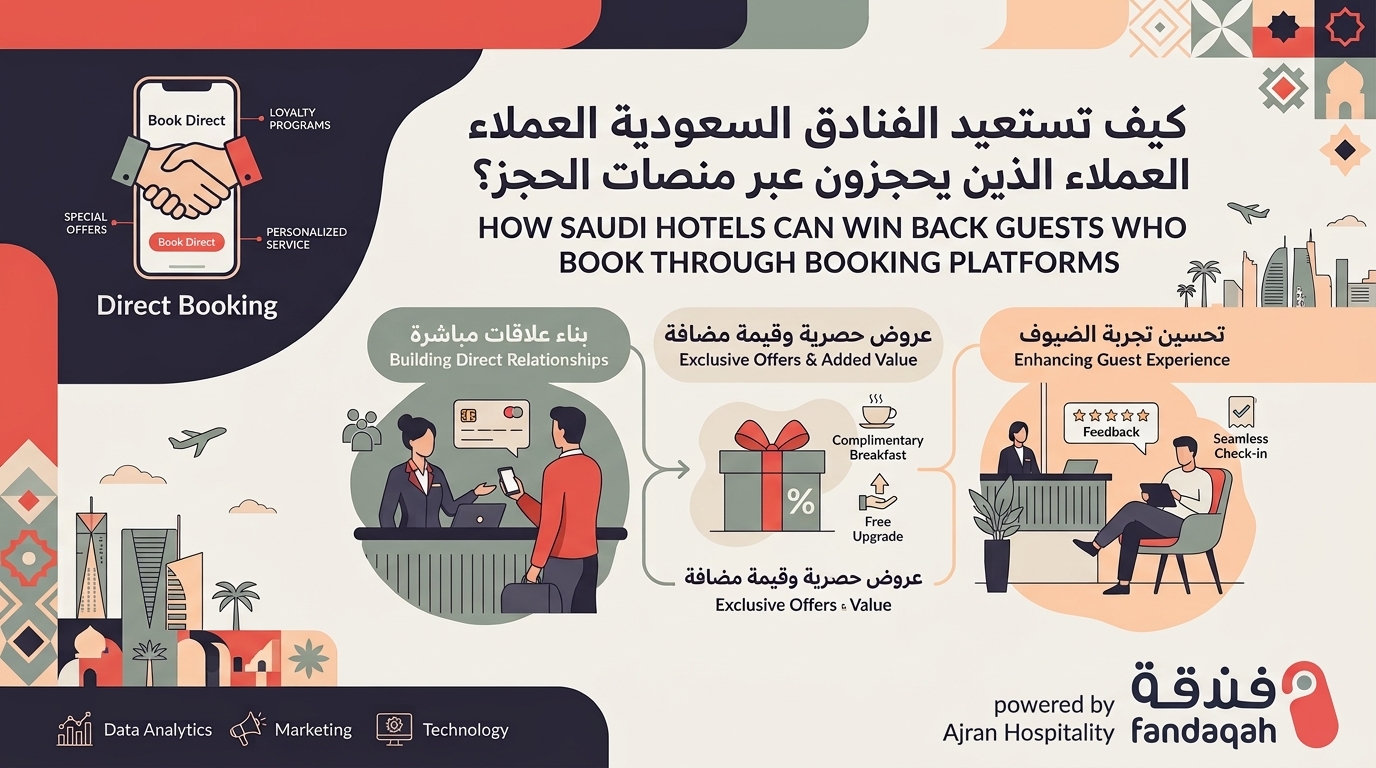
Saudi hotels can reclaim direct bookings from OTAs. Discover expert strategies to enhance guest loyalty, personalize experiences, optimize your online presence, and drive repeat business directly to y...
Discover why hotel guests will increasingly choose WhatsApp over traditional phone calls by 2026. Explore the convenience, efficiency, and personalized communication driving this digital shift in hosp...
Uncover the top reasons guests abandon hotel bookings before payment and learn expert strategies to reduce cart abandonment, boost conversions, and maximize revenue....
Prepare for the future of hospitality in Saudi Arabia. Discover the top 10 trends poised to shape hotel revenue in 2027, from AI integration to sustainable tourism, and learn how to optimize your stra...
Unlock the untapped revenue potential hidden within your hotel rooms. Discover expert strategies, from personalized upsells to smart technology, to maximize profitability and guest satisfaction withou...
Uncover the unique motivations behind Saudi guests' hotel reviews and the cultural nuances that drive virality. Learn how hospitality businesses can leverage these insights for unparalleled guest enga...
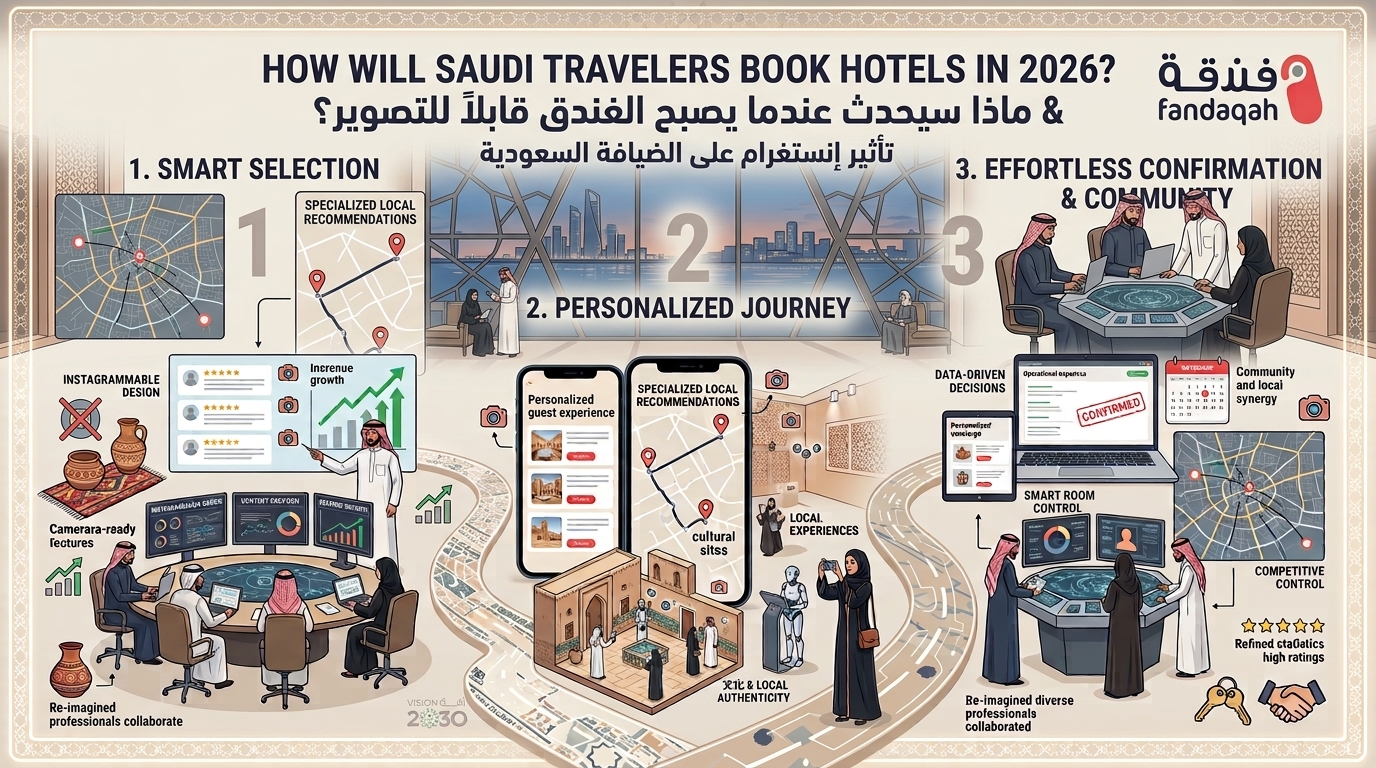
Explore the transformative impact of Instagrammable design on Saudi Arabia's burgeoning hospitality sector. Discover how aesthetics, technology, and cultural narratives are driving unprecedented growt...
Explore the future of hospitality in Saudi Arabia. Discover how AI, robotics, and hyper-personalization will transform Saudi hotels by 2030, offering unparalleled luxury and efficiency. ...
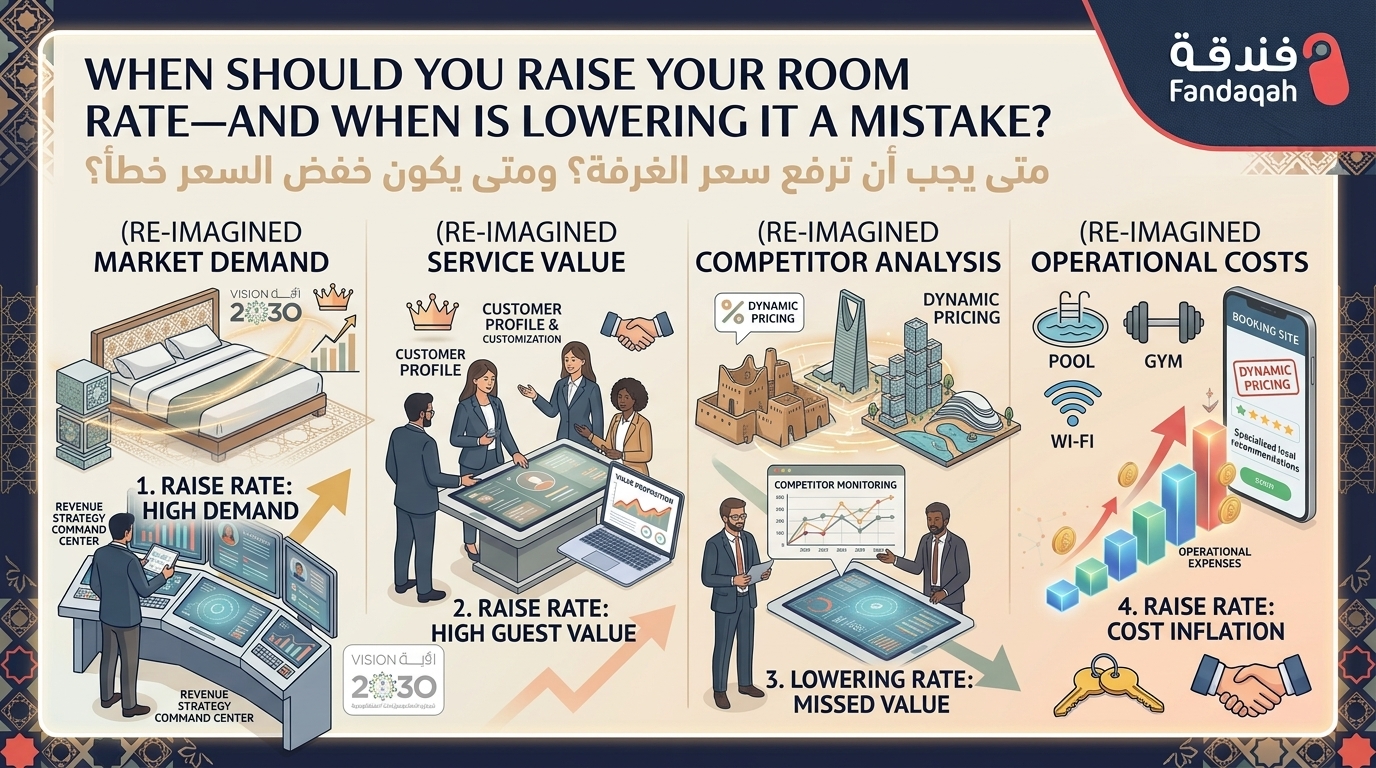
Maximize your hotel's profitability. Discover the strategic moments to raise your room rates and crucial times when lowering prices can be a costly mistake. Learn to optimize your pricing strategy fo...
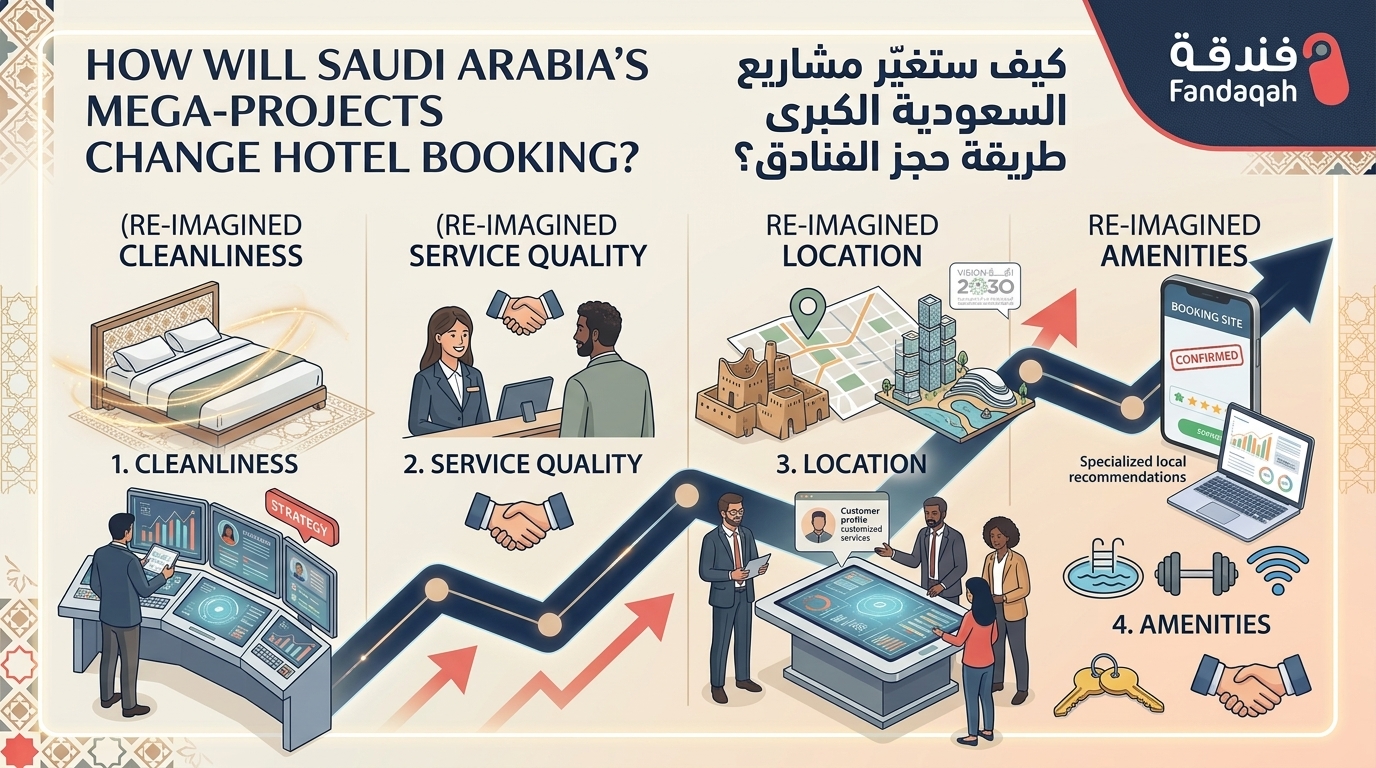
Saudi Arabia's ambitious mega-projects like NEOM, Red Sea Project, and Qiddiya are set to revolutionize global tourism and hotel booking. Discover how these futuristic developments will reshape travel...
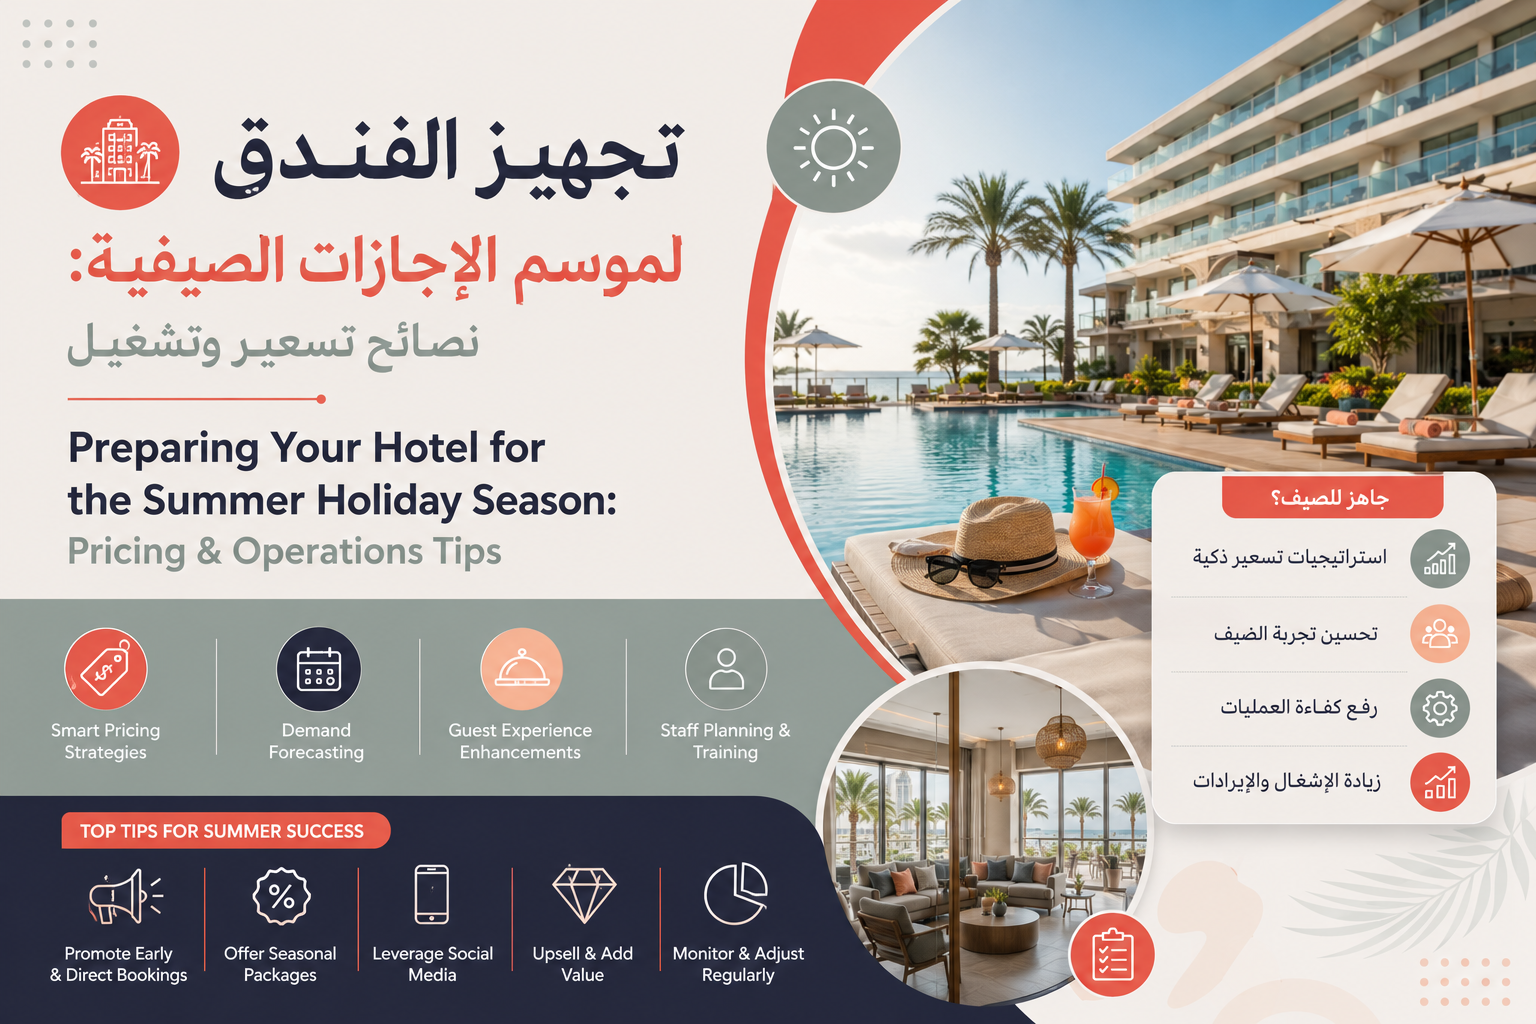
Maximize summer hotel revenue in Saudi Arabia with dynamic pricing, family packages, staffing tips & operations best practices. Align with Vision 2030 for higher RevPAR and guest satisfaction....
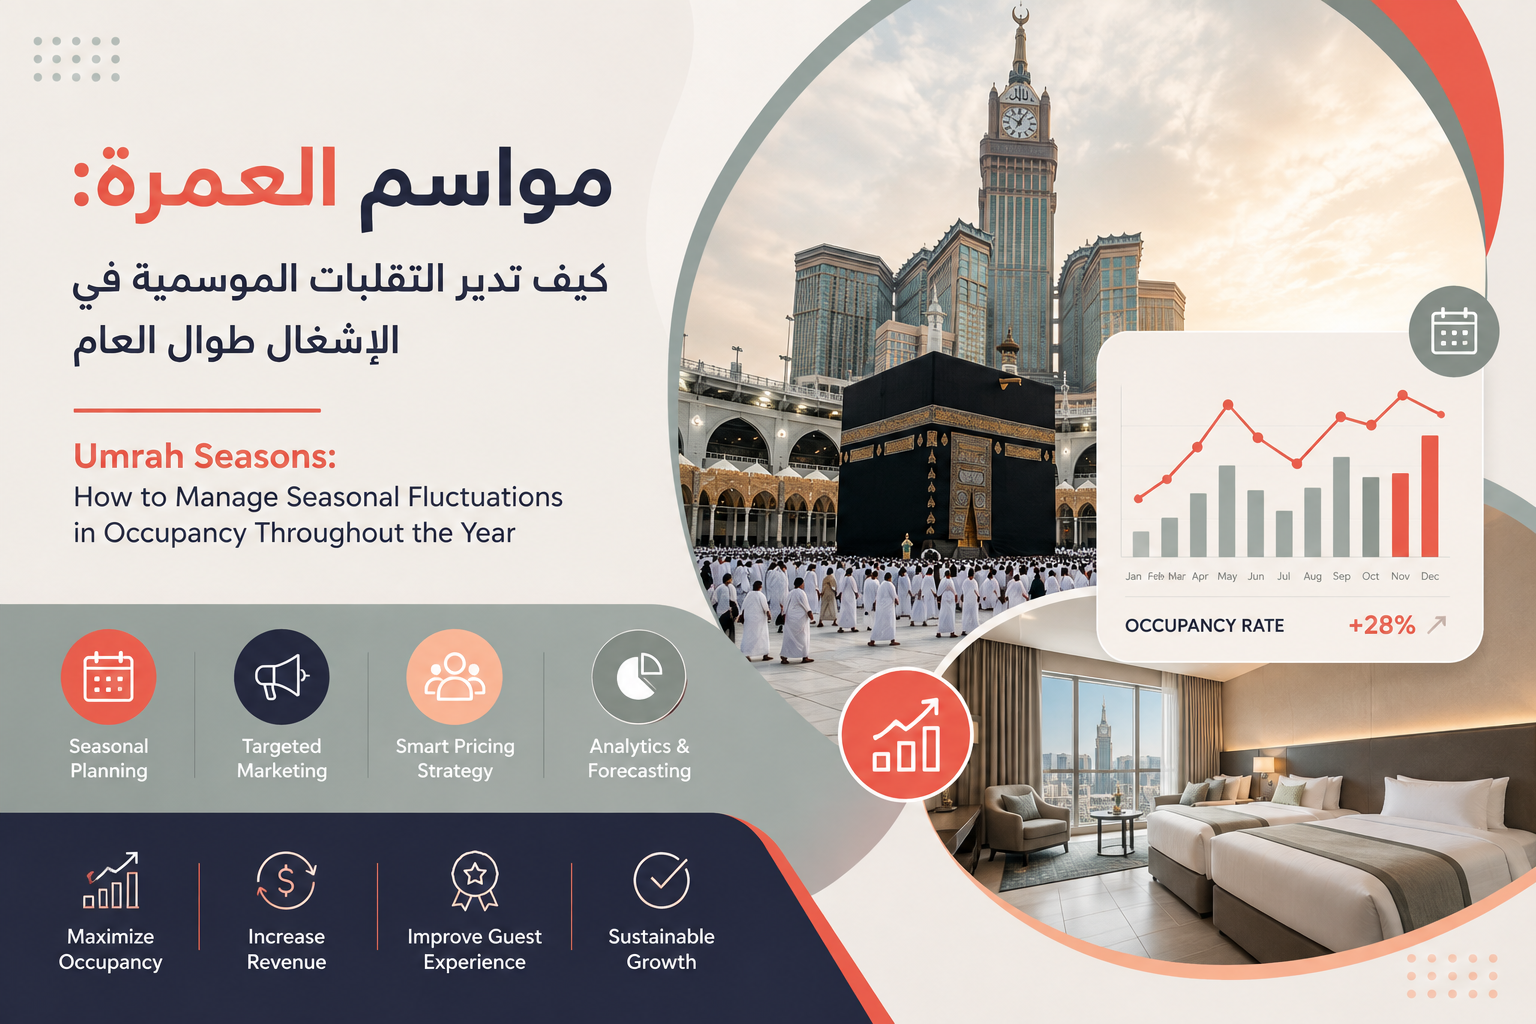
Master Umrah seasonal occupancy with dynamic pricing, packages, loyalty programs & Fandaqah.com. Strategies to boost RevPAR in Ramadan peaks and fill rooms in low seasons....
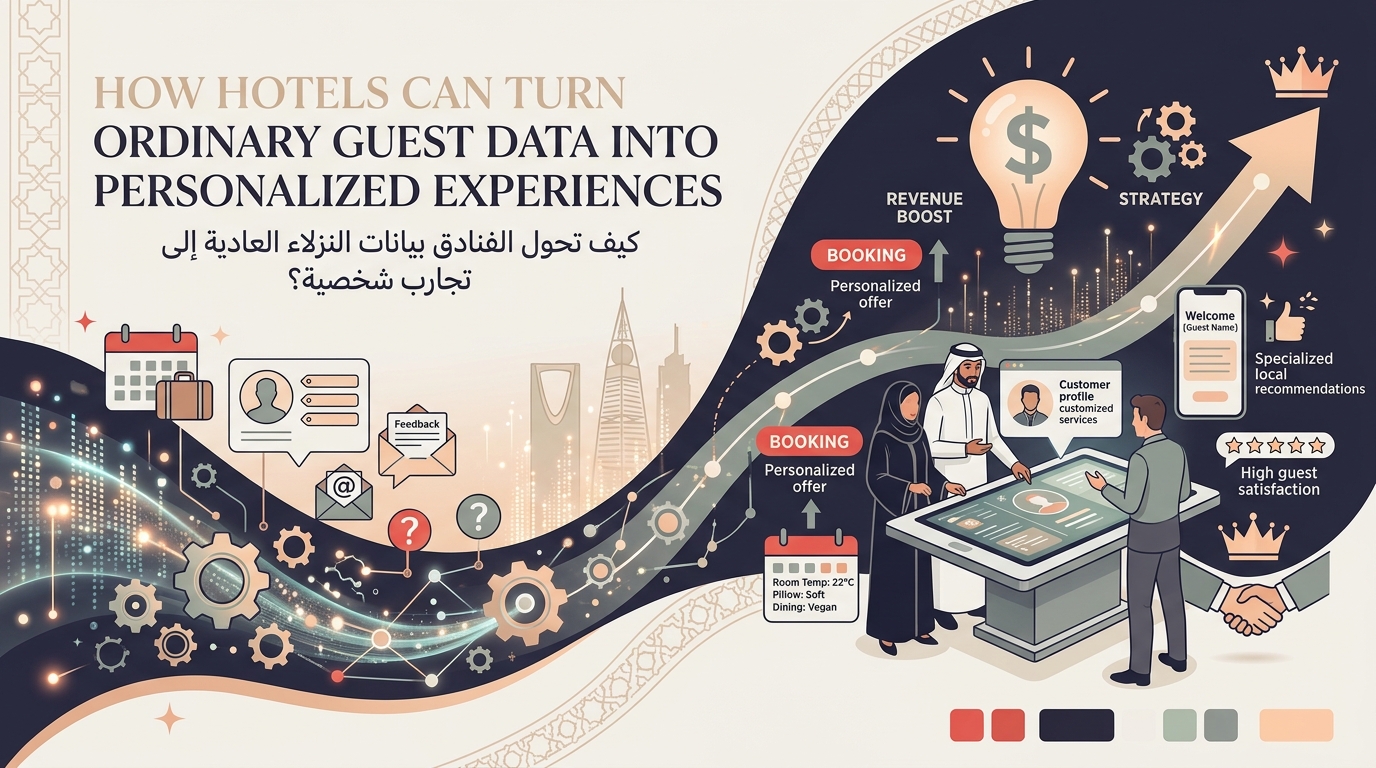
Unlock the power of guest data to craft unforgettable, personalized hotel experiences. Learn strategies to collect, analyze, and apply insights for enhanced loyalty and revenue. ...

Unlock the power of domestic tourism in Saudi Arabia. Discover expert strategies for hotels to transform local guests into loyal, repeat customers, driving sustainable growth in this dynamic market. ...

Unlock the secrets to converting TikTok views into bookings for Saudi hotels. Discover expert strategies, content types, and measurement techniques to maximize your social media ROI in the Kingdom's d...
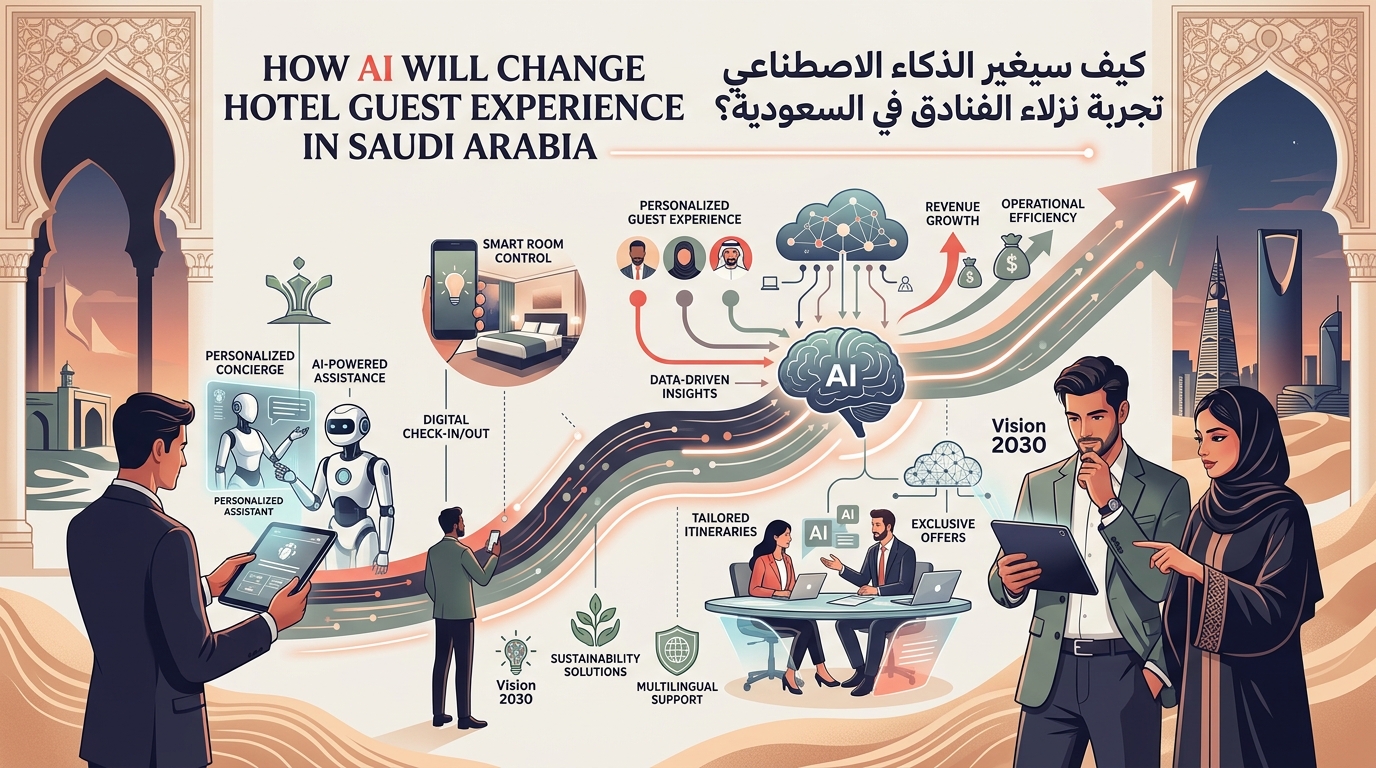
Explore how AI is revolutionizing hotel guest experiences in Saudi Arabia. From personalized service to smart rooms, discover the future of hospitality in the Kingdom. ...
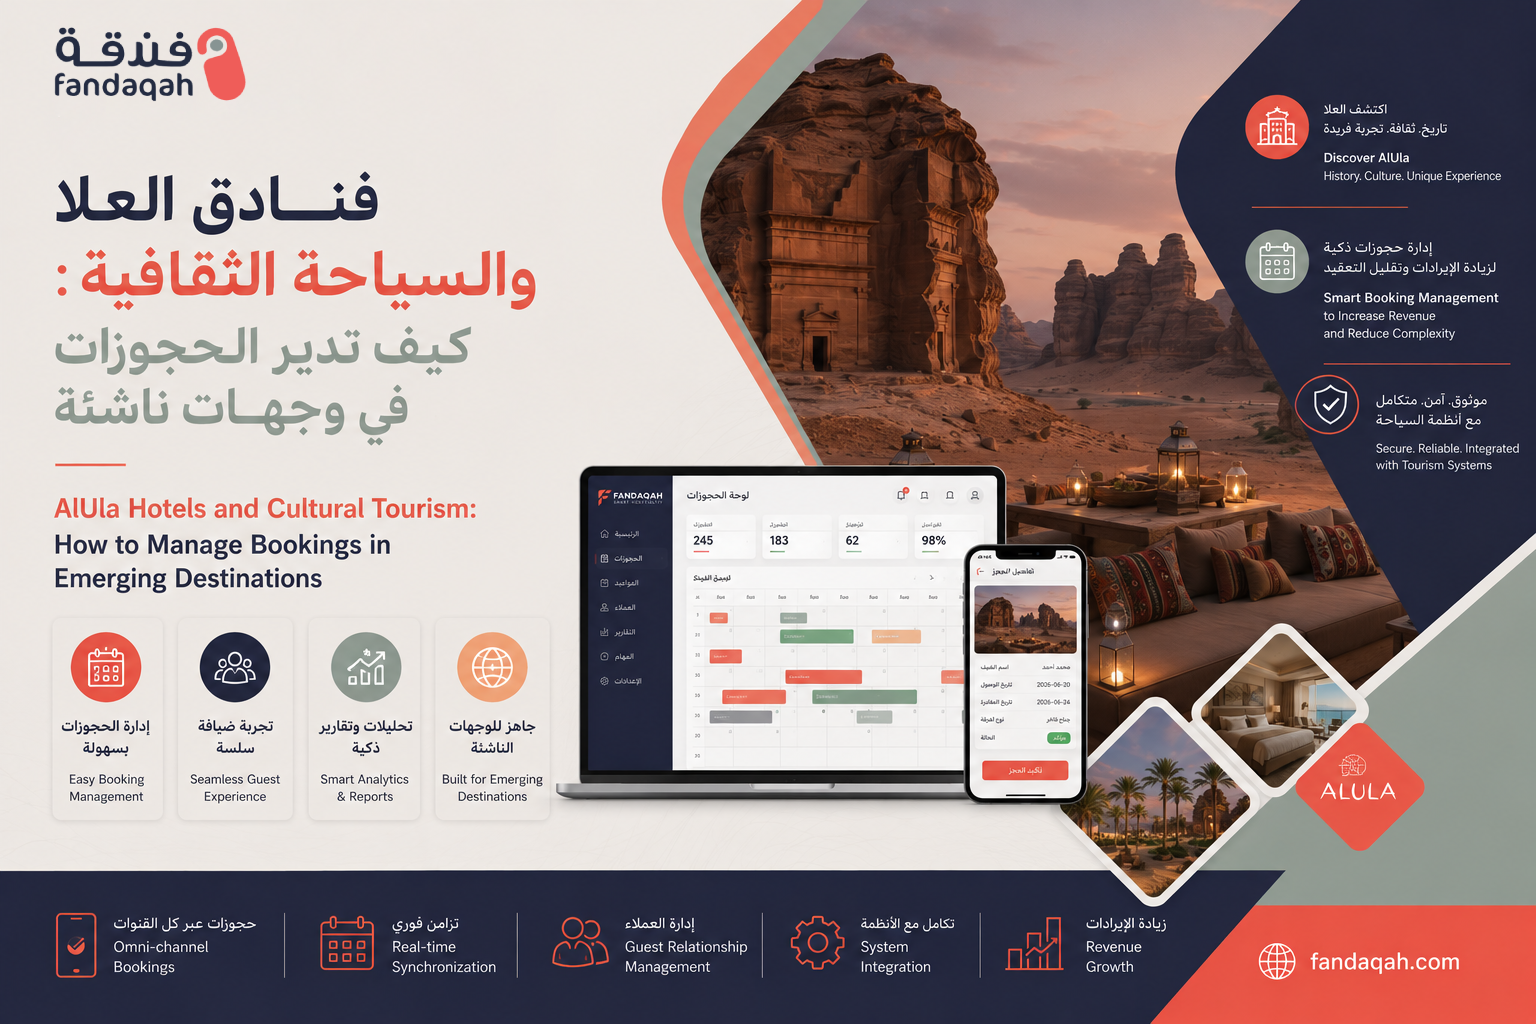
Learn how to manage AlUla hotel bookings in this emerging cultural destination. Best times, prices, accommodation types & tips for Hegra, Winter at Tantora. Compare on Fandaqah.com....

Discover how The Red Sea Project, AMAALA & Sindalah prepare Saudi hotels for global luxury standards. Sustainability, AI tech, Vision 2030 & top resorts reviewed on Fandaqah.com....

Discover effective Saudi National Day hotel offers, staycation packages, and campaigns. Boost occupancy with family deals, luxury experiences, and Vision 2030-aligned promotions across Riyadh, Jeddah ...

Proven strategies to boost weekend occupancy in Saudi secondary cities. Packages, social media, local partnerships & Vision 2030 tips for hotels in Abha, Taif, AlUla & more....
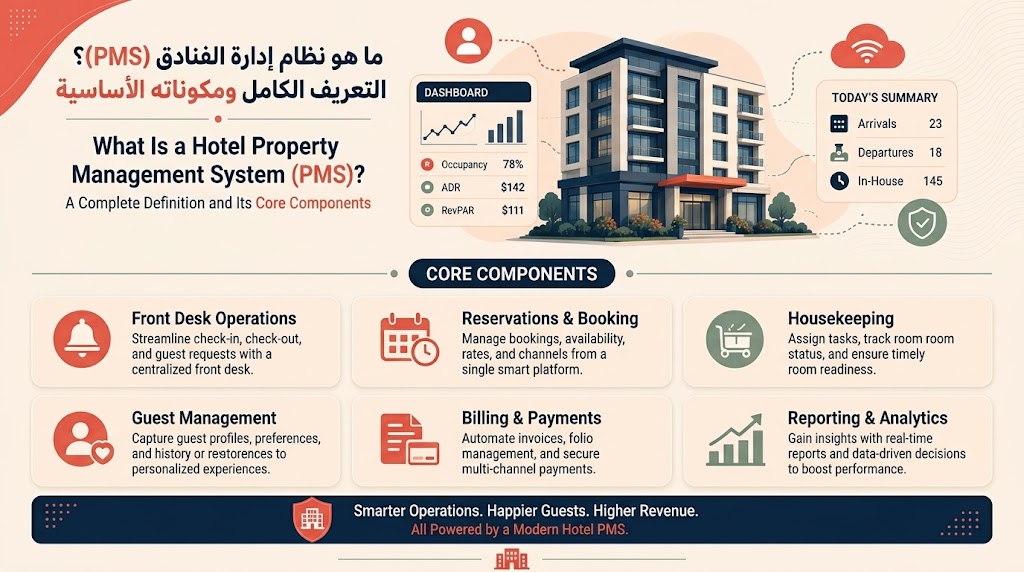
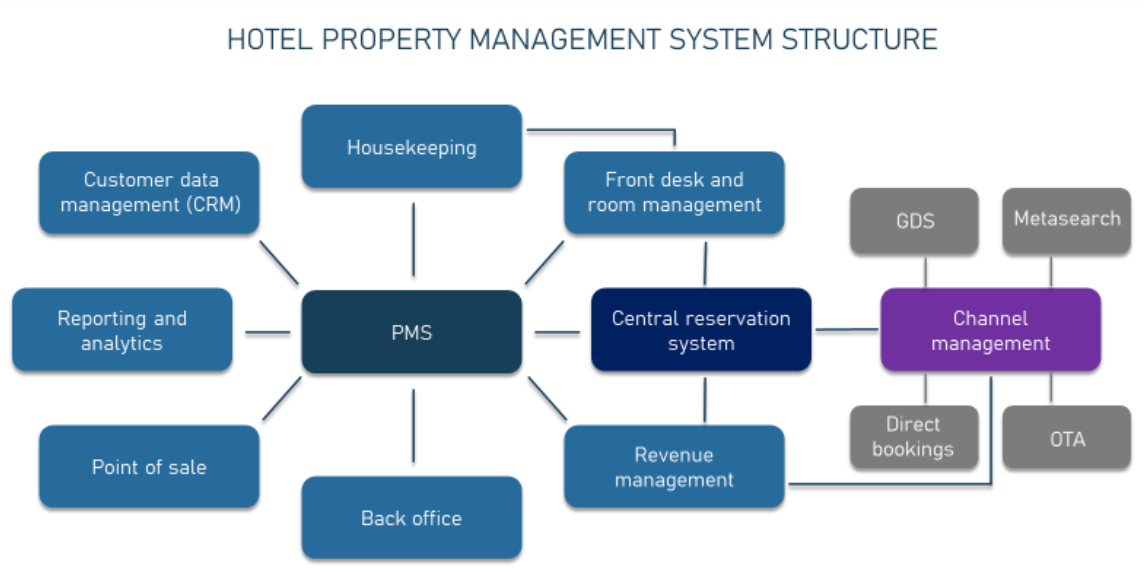
A Hotel PMS is the central software for managing reservations, rooms, guests, check-in/out, billing & reporting. Learn core components, benefits & how Saudi hotels can choose the right system....
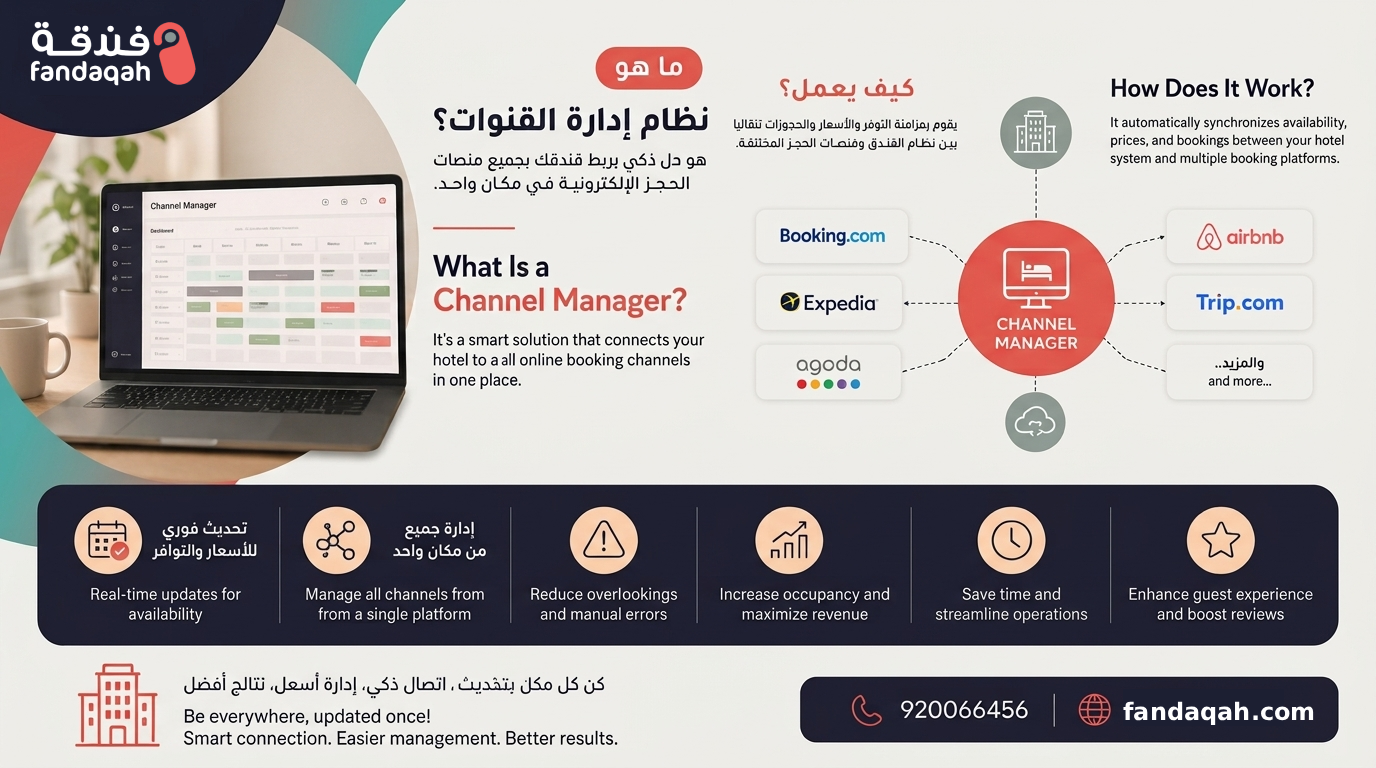
A hotel Channel Manager syncs rates, availability & reservations across OTAs from one place. Learn how it cuts overbooking risk, saves time & boosts distribution for Saudi hotels....

Learn what a direct booking engine is and how Saudi hotels can use it to cut OTA commissions by 15–25%, own guest data, boost direct revenue, and improve profitability under Vision 2030....
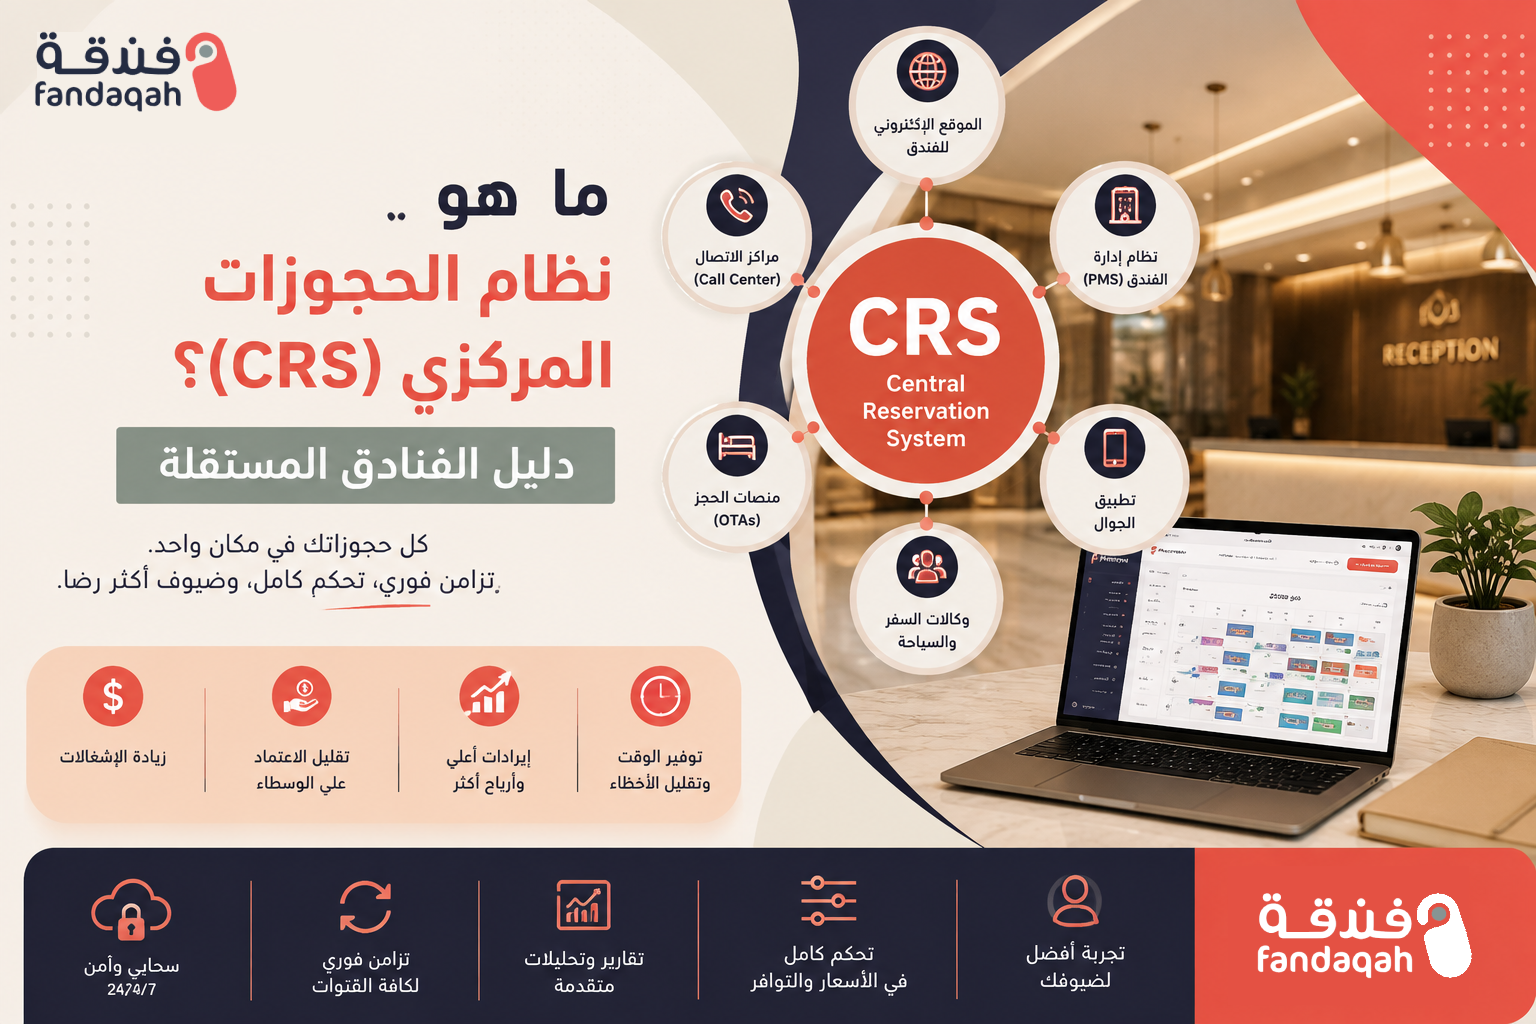
Discover what a Central Reservation System (CRS) is and how independent hotels in Saudi Arabia can use it to prevent overbookings, boost direct bookings, and maximize revenue under Vision 2030....
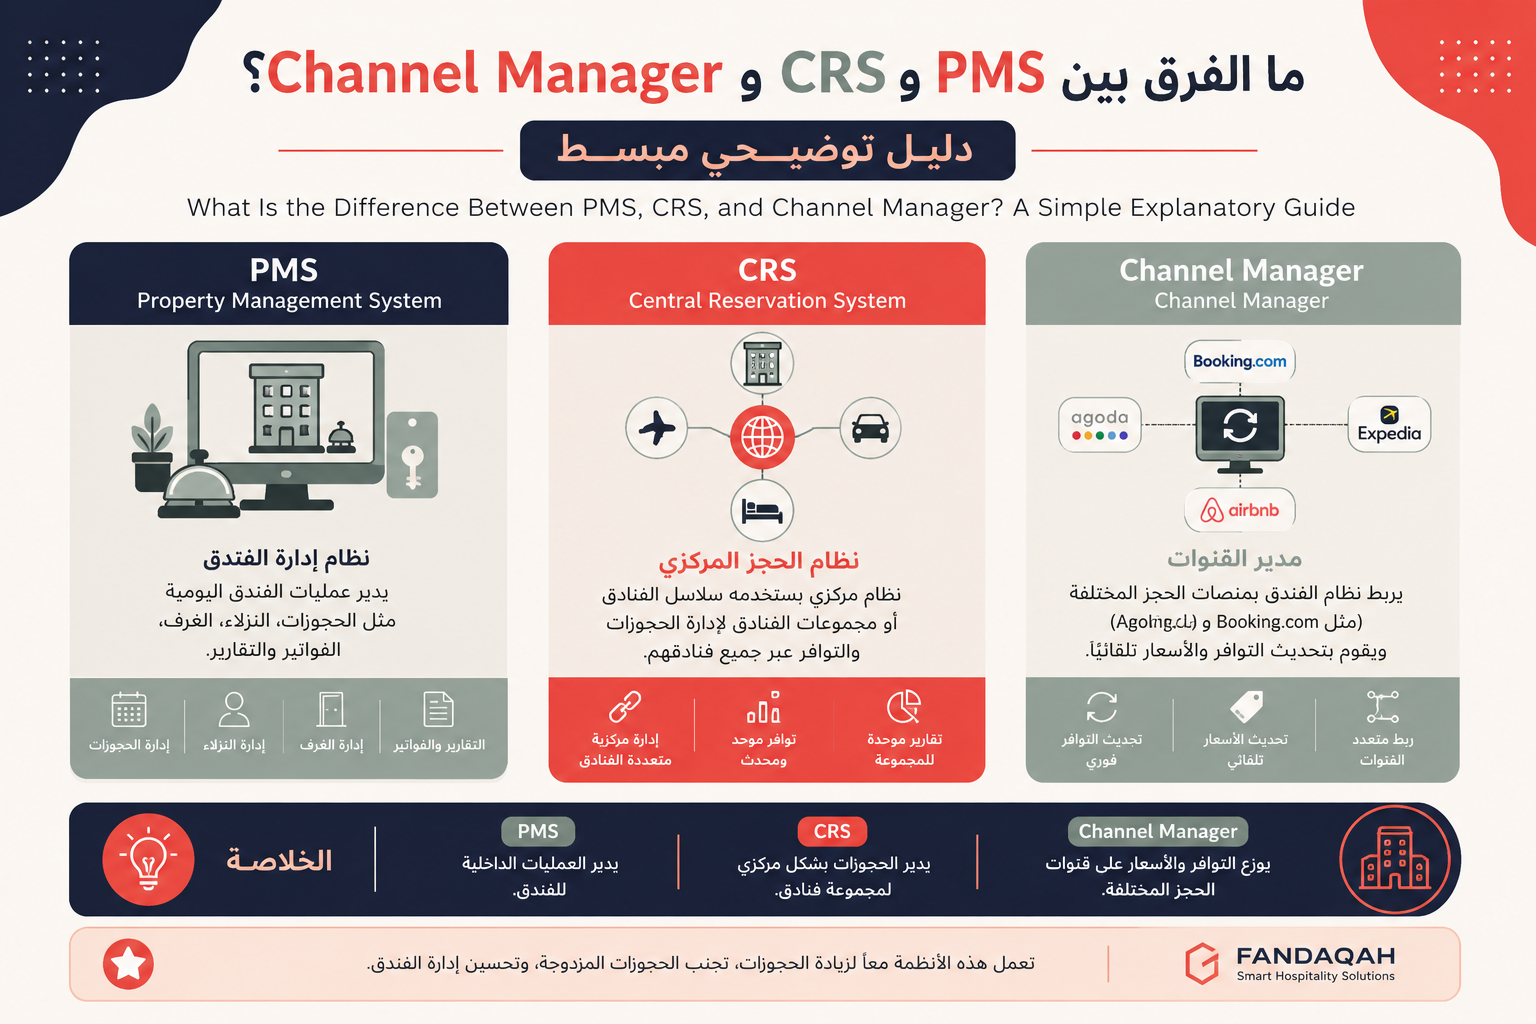
Clear differences between PMS, CRS, and Channel Manager explained. Learn which systems Saudi hotels need for operations, central bookings, and OTA distribution....
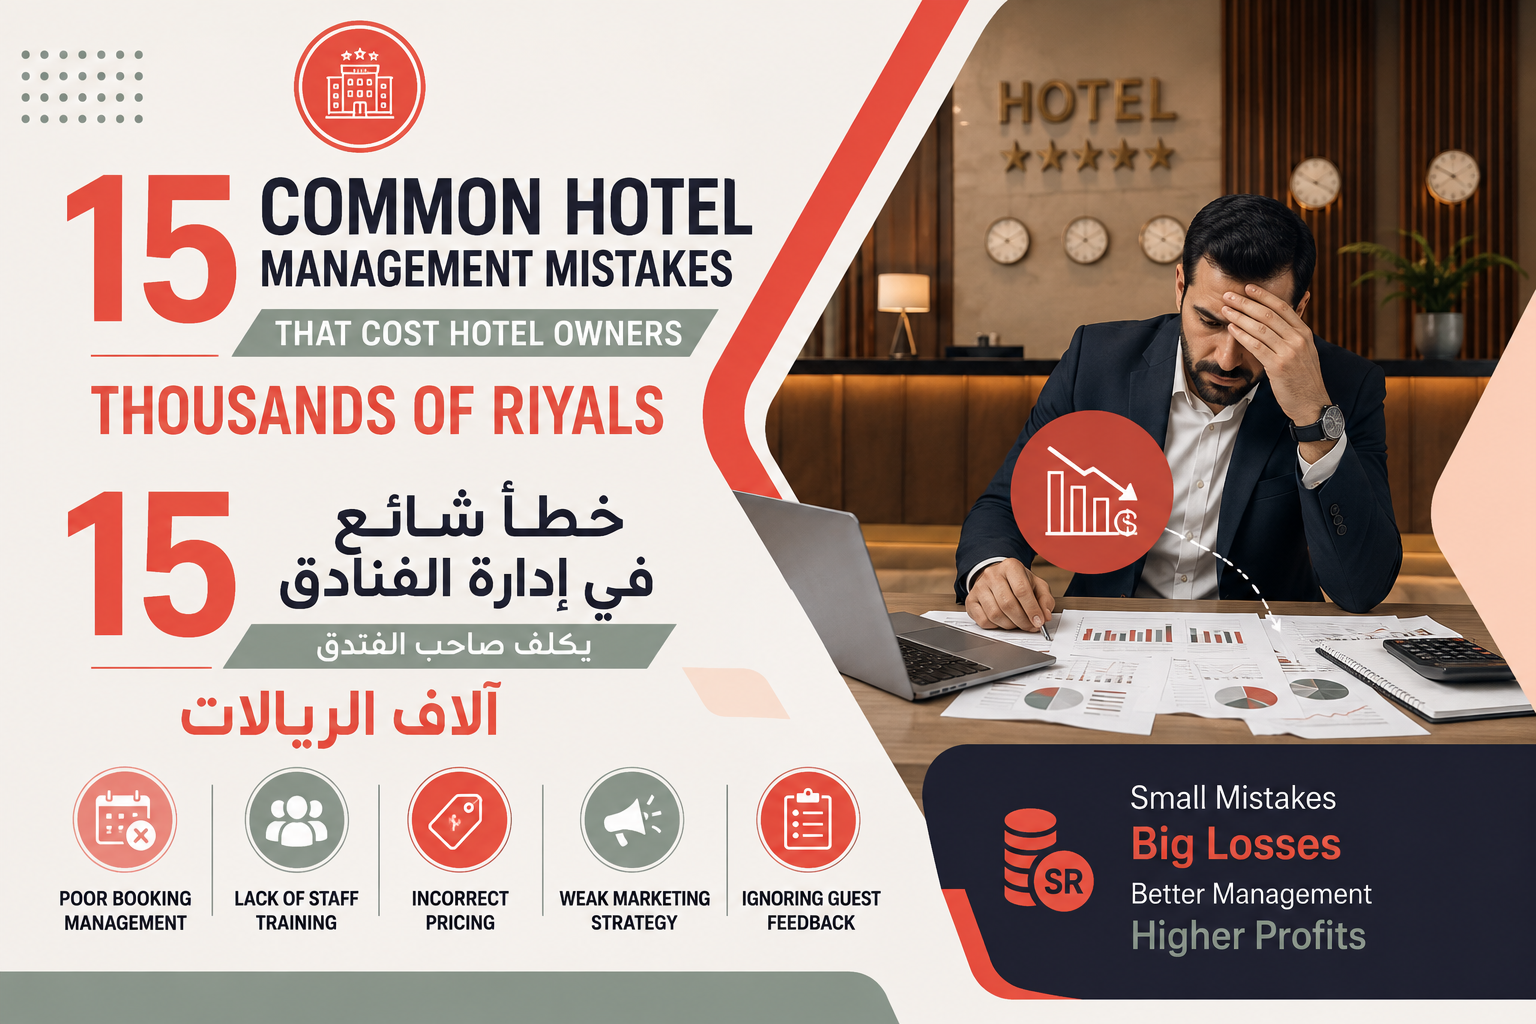
Discover the 15 most common hotel management mistakes draining Saudi hotel revenue. Practical fixes for booking systems, pricing, staff training, reviews & Vision 2030 alignment....
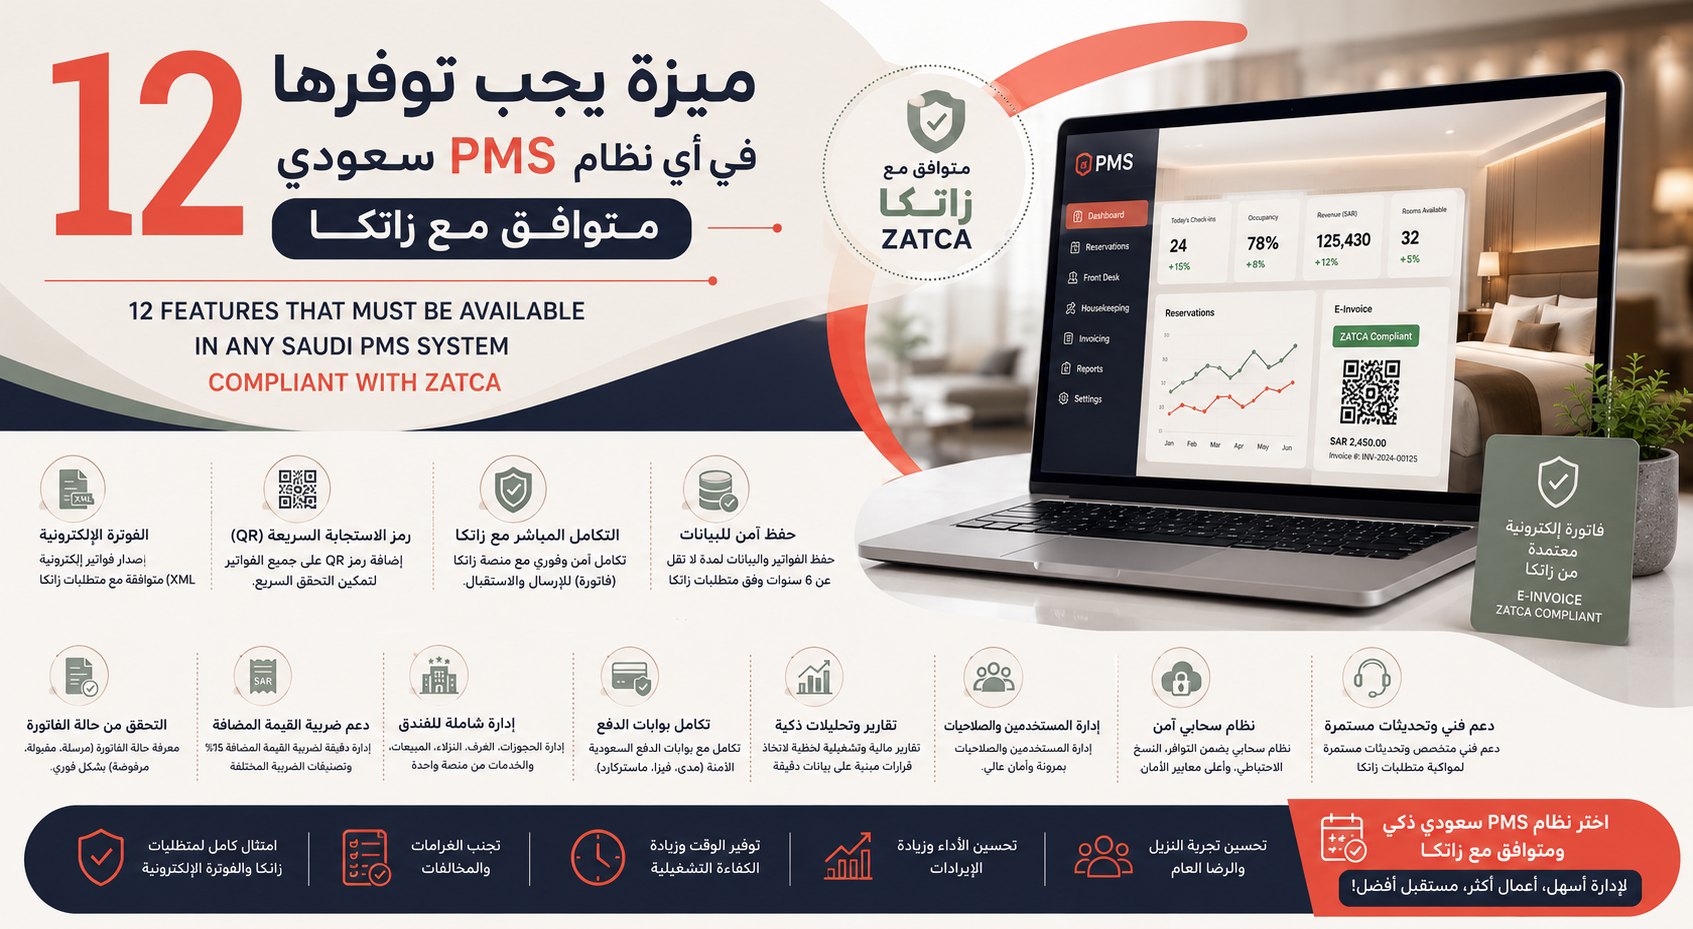
Discover the 12 essential features every Saudi property management system needs for full ZATCA e-invoicing compliance, Fatoora & Ejar integration, and seamless operations....
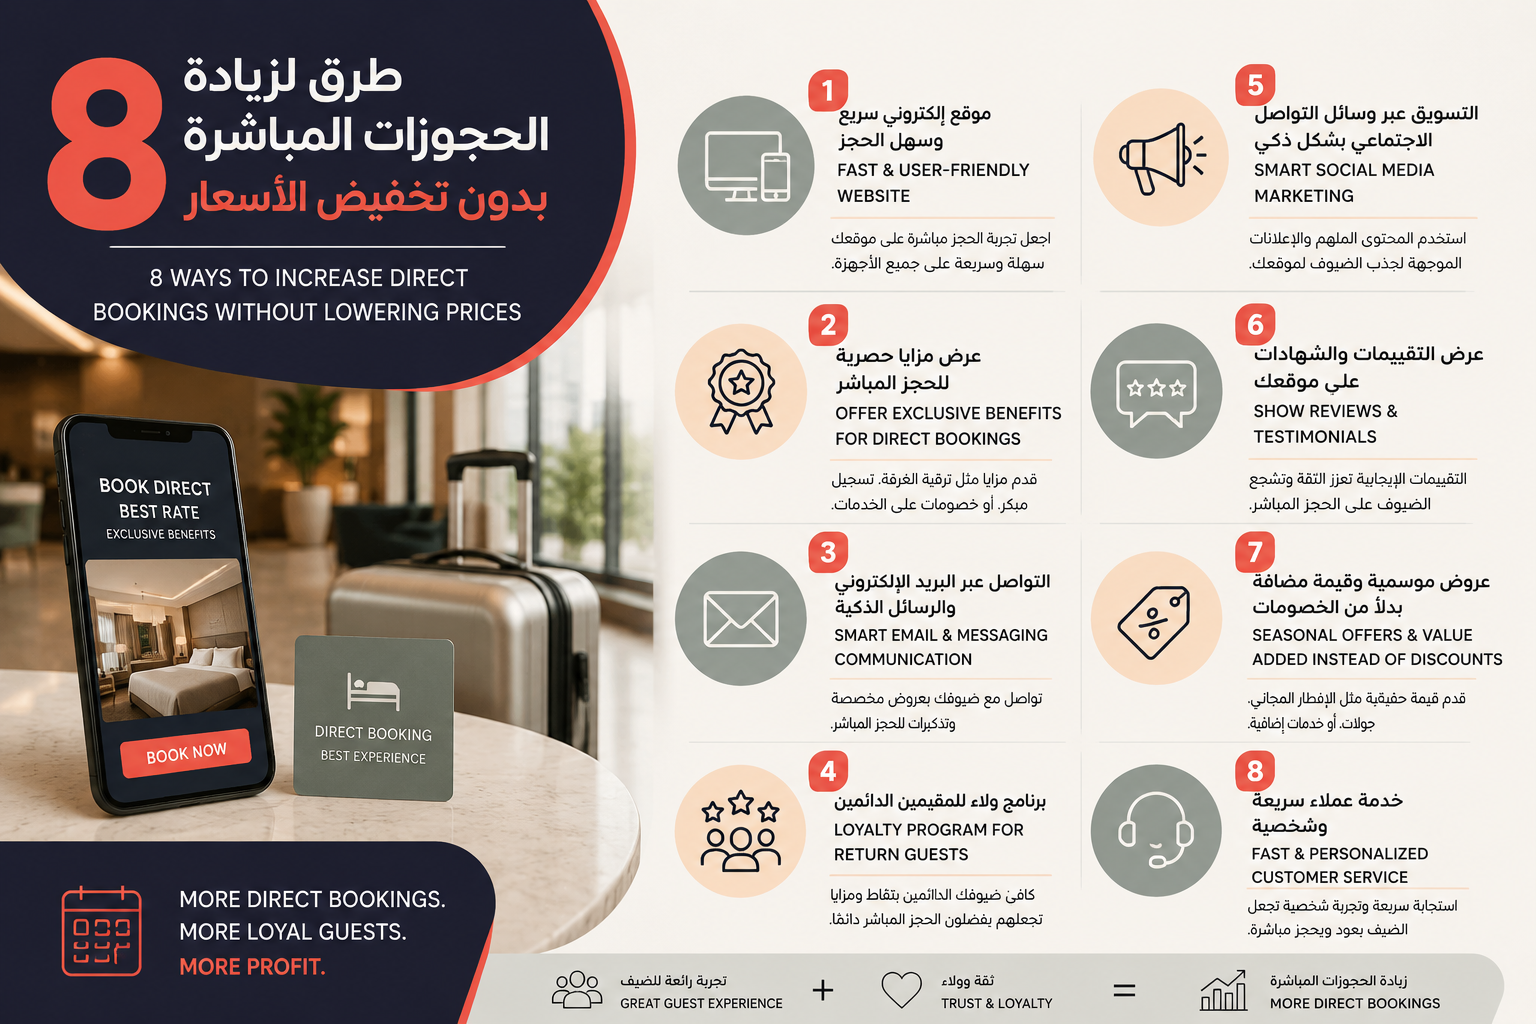
Discover 8 proven strategies for Saudi hotels to increase direct bookings without lowering prices. Optimize your booking engine, loyalty programs & more aligned with Vision 2030....
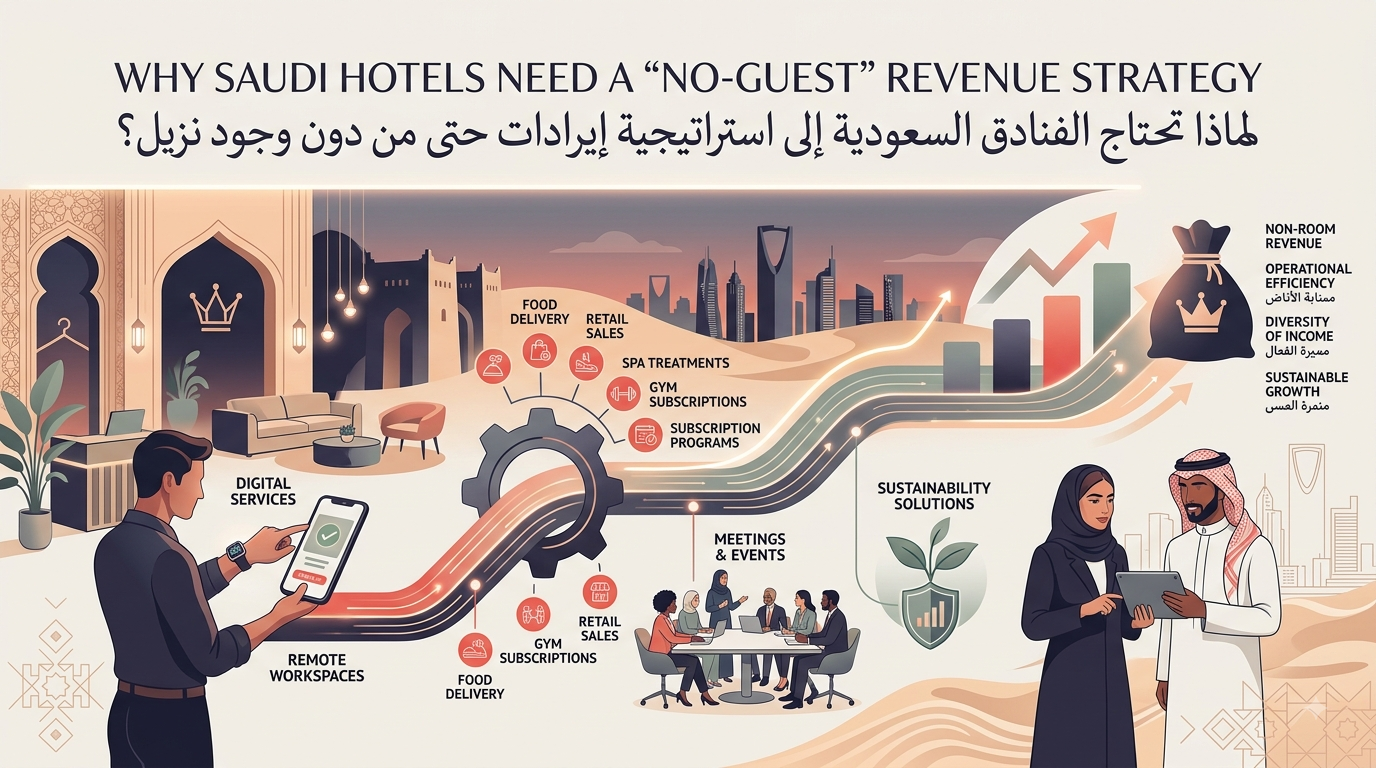
Unlock new profit streams beyond room nights. Discover why Saudi hotels must embrace "no-guest" revenue strategies to enhance profitability, diversify income, and boost guest loyalty in a competitive ...
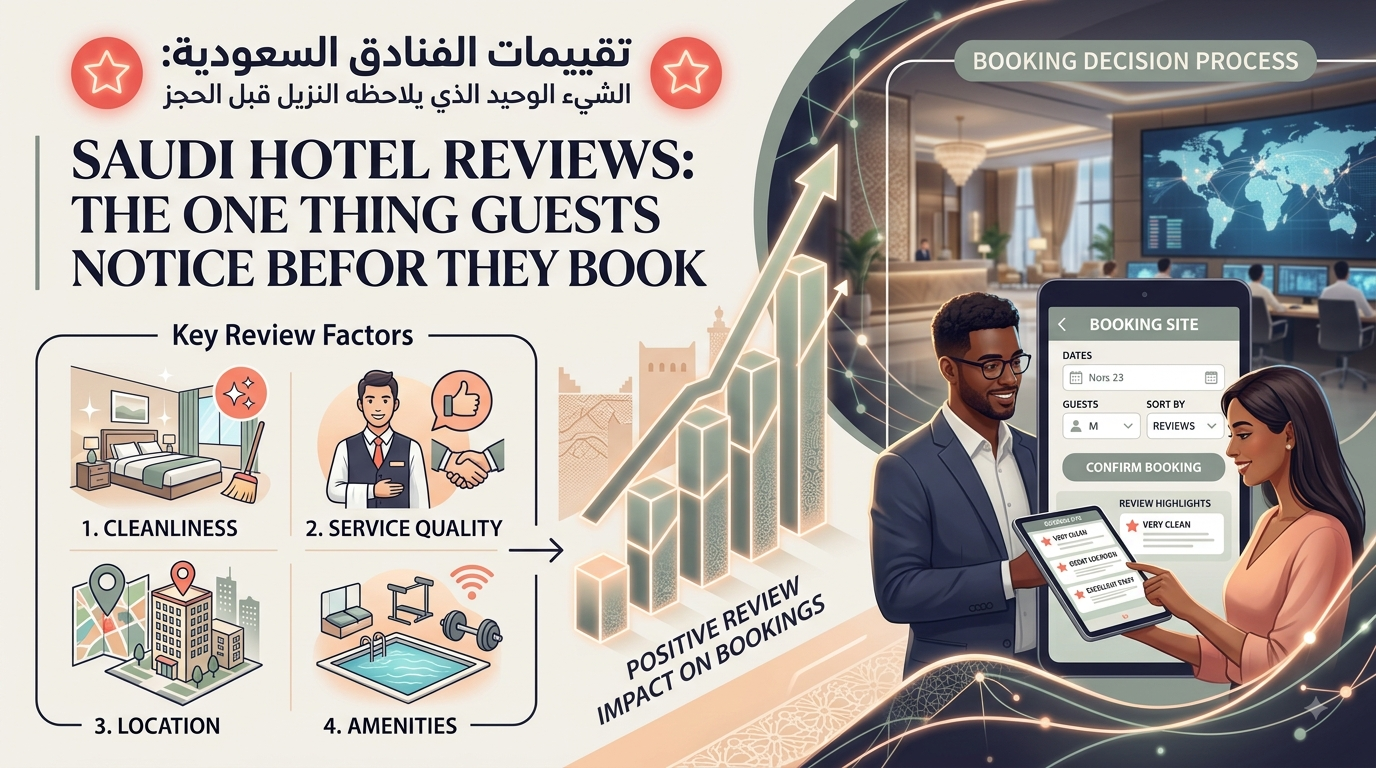
Discover the ultimate factor influencing Saudi hotel bookings. Learn how online reviews, especially around service and culture, shape guest decisions and why they're crucial for your next stay. ...
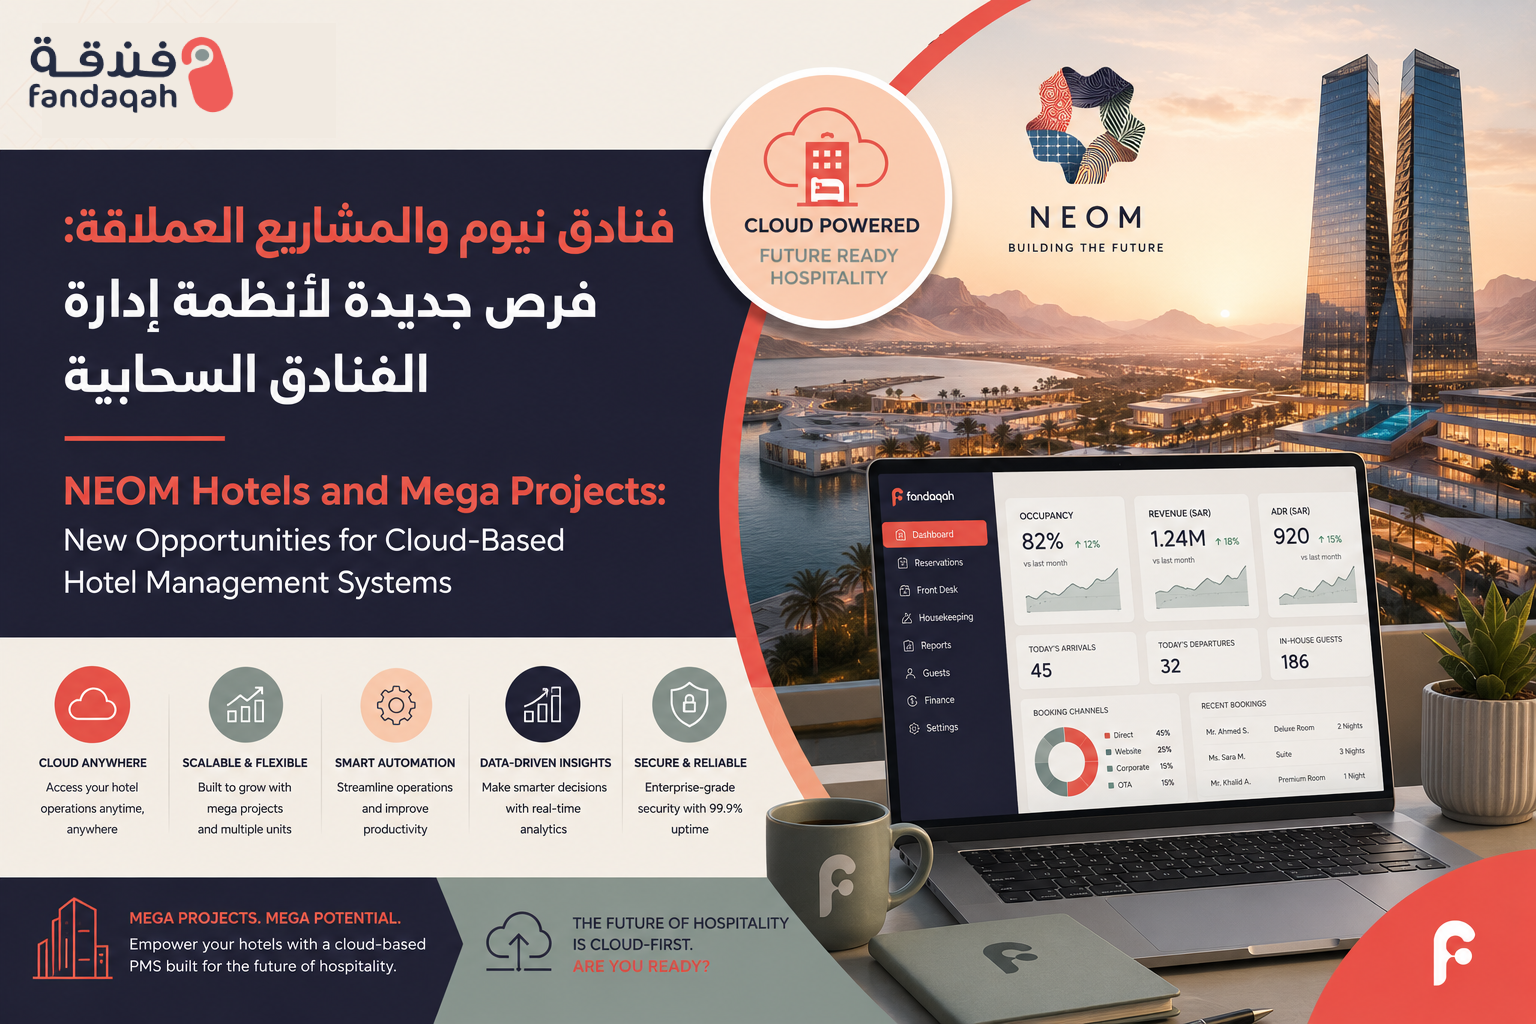
Discover how NEOM hotels and Saudi mega projects create huge opportunities for cloud-based hotel management systems. Boost efficiency, guest experience & Vision 2030 readiness....

Explore the battle between Saudi hotels and short-term rentals for today's traveler. Discover which accommodation type offers the best experience, value, and authenticity for your next Saudi adventure...
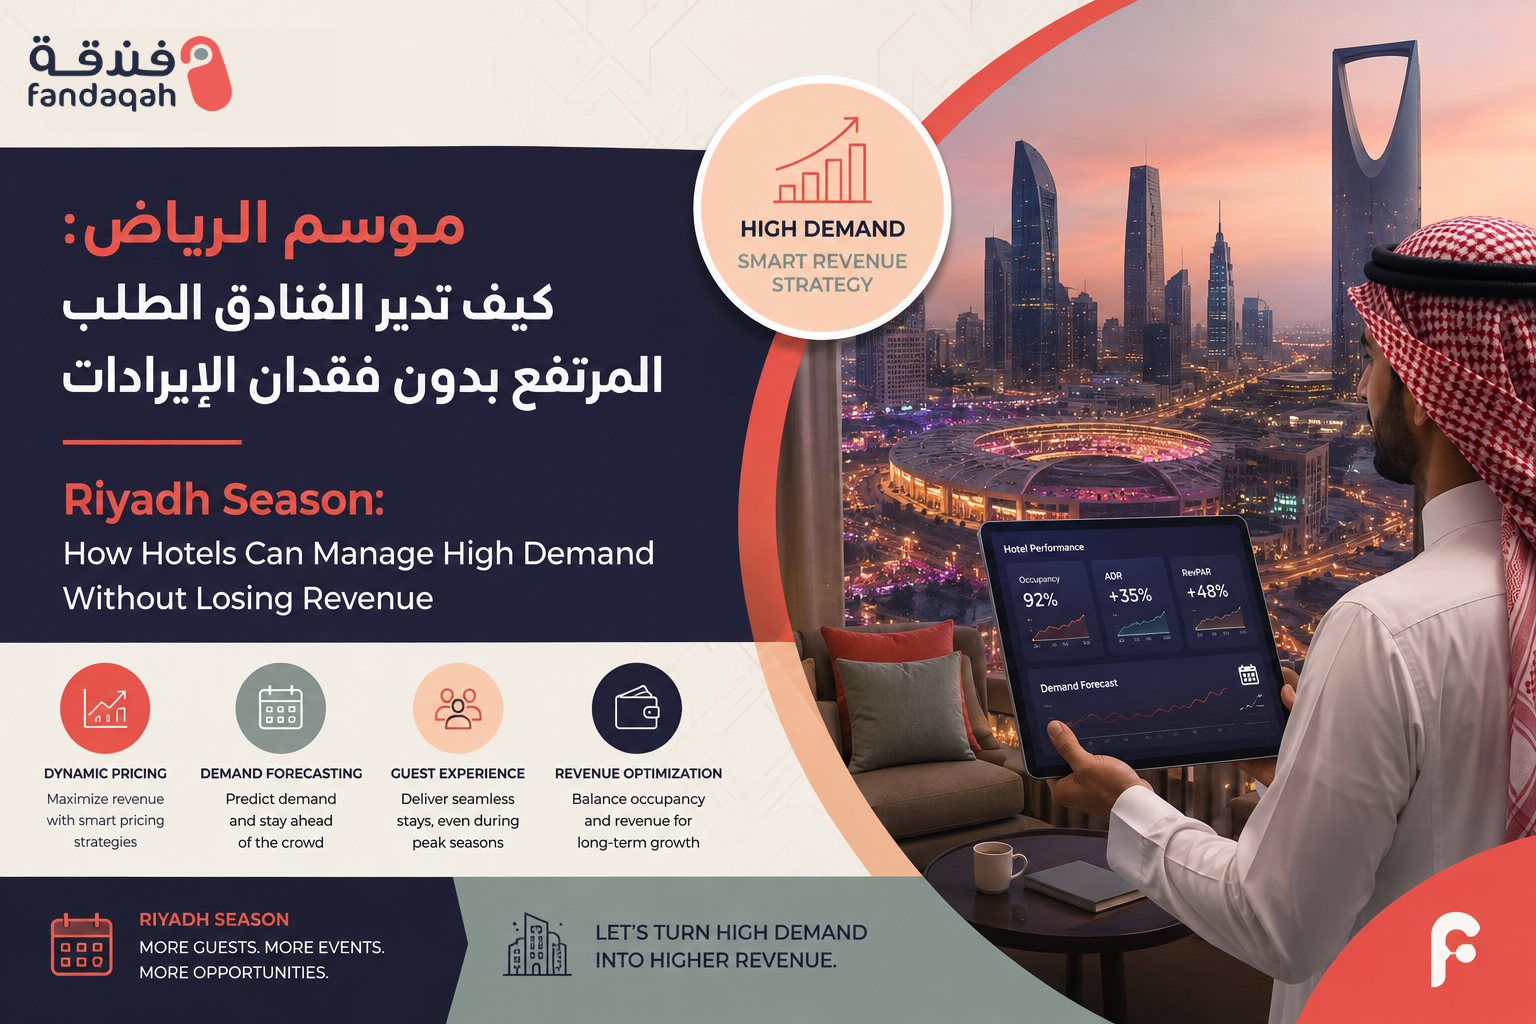
Learn how hotels manage high demand during Riyadh Season with dynamic pricing, demand forecasting & smart strategies to maximize revenue without losses....
Discover how creating a single, highly photogenic "Instagram Room" can significantly boost hotel revenue through organic social media marketing, enhanced guest experience, and increased bookings. Lear...

How Saudi hotels are gearing up for the 2034 FIFA World Cup: capacity expansion, smart tech, sustainability, and Vision 2030 strategies to deliver world-class hospitality for millions of fans....
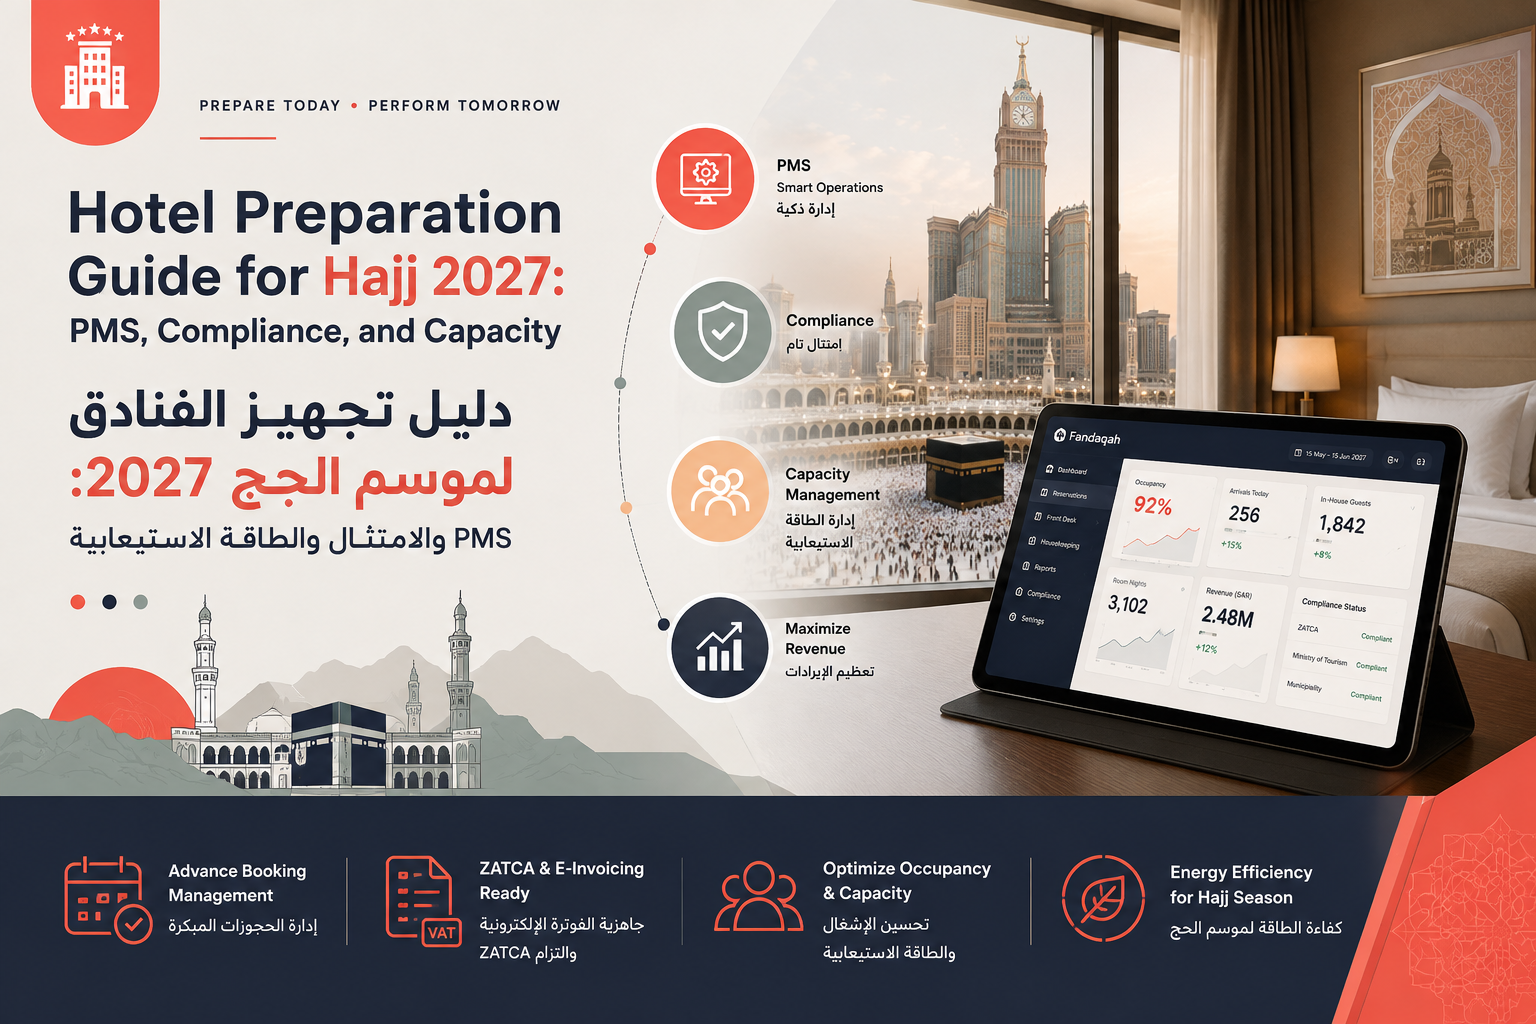
Prepare your hotel for Hajj 2027 with modern PMS systems, full Ministry of Hajj & Umrah compliance, and smart capacity management. Boost efficiency, pilgrim experience, and seasonal revenue....
Unlock more bookings without spending more. Discover expert strategies to optimize your hotel's online presence, enhance guest experience, and leverage existing resources for maximum revenue growth. ...

Discover how AI is revolutionizing hotel management in Saudi Arabia by 2026. Explore key trends, applications, and the strategic advantages AI offers in enhancing guest experience, optimizing operatio...
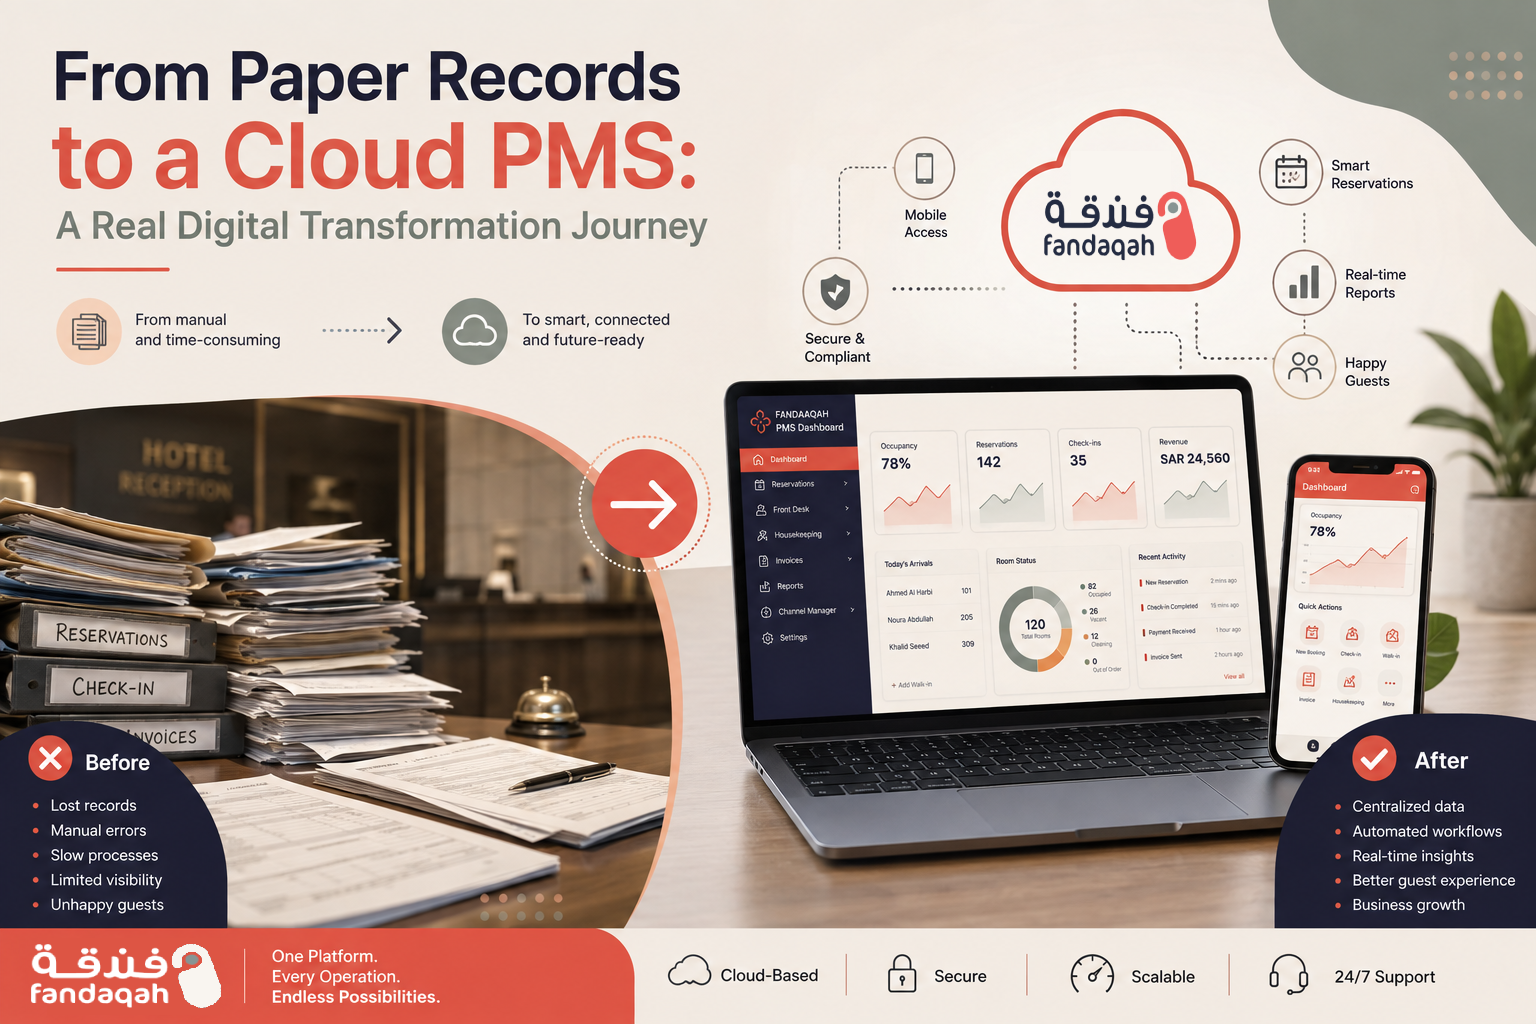
Discover how Saudi hotels move from paper records to a cloud PMS. Boost efficiency, guest experience & align with Vision 2030. Real benefits, comparison & FAQ....
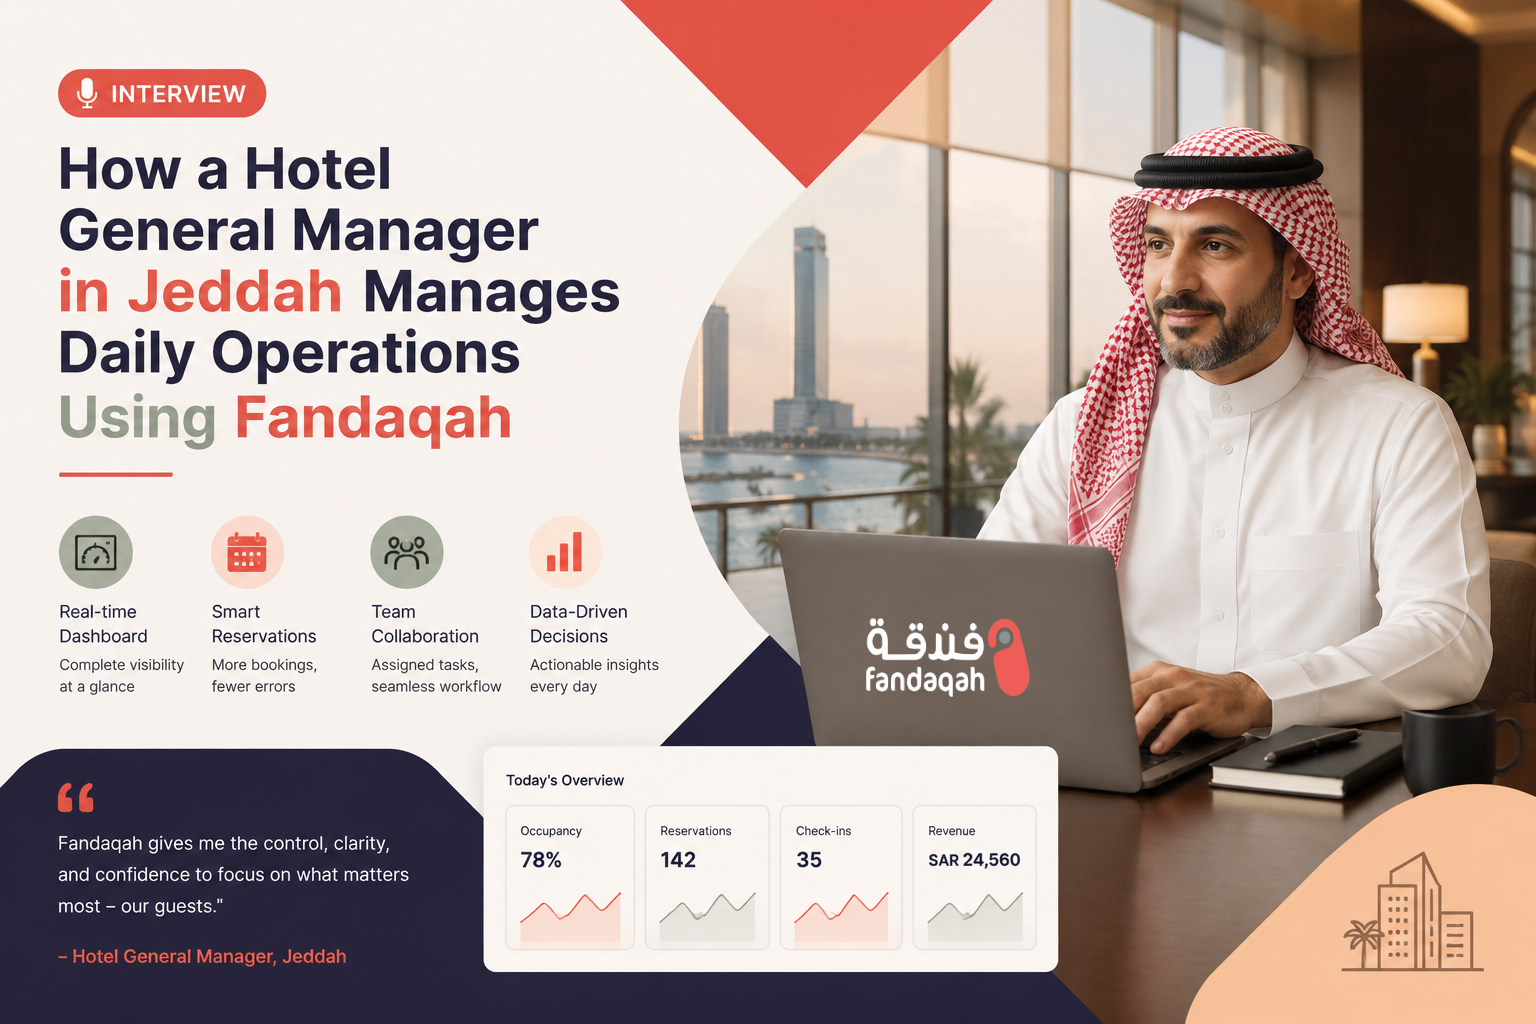
Exclusive interview with Khalid Al-Shahri, Jeddah hotel GM, on how Fandaqah PMS eliminated double bookings, cut check-in to 3 min, and boosted occupancy to 78%....
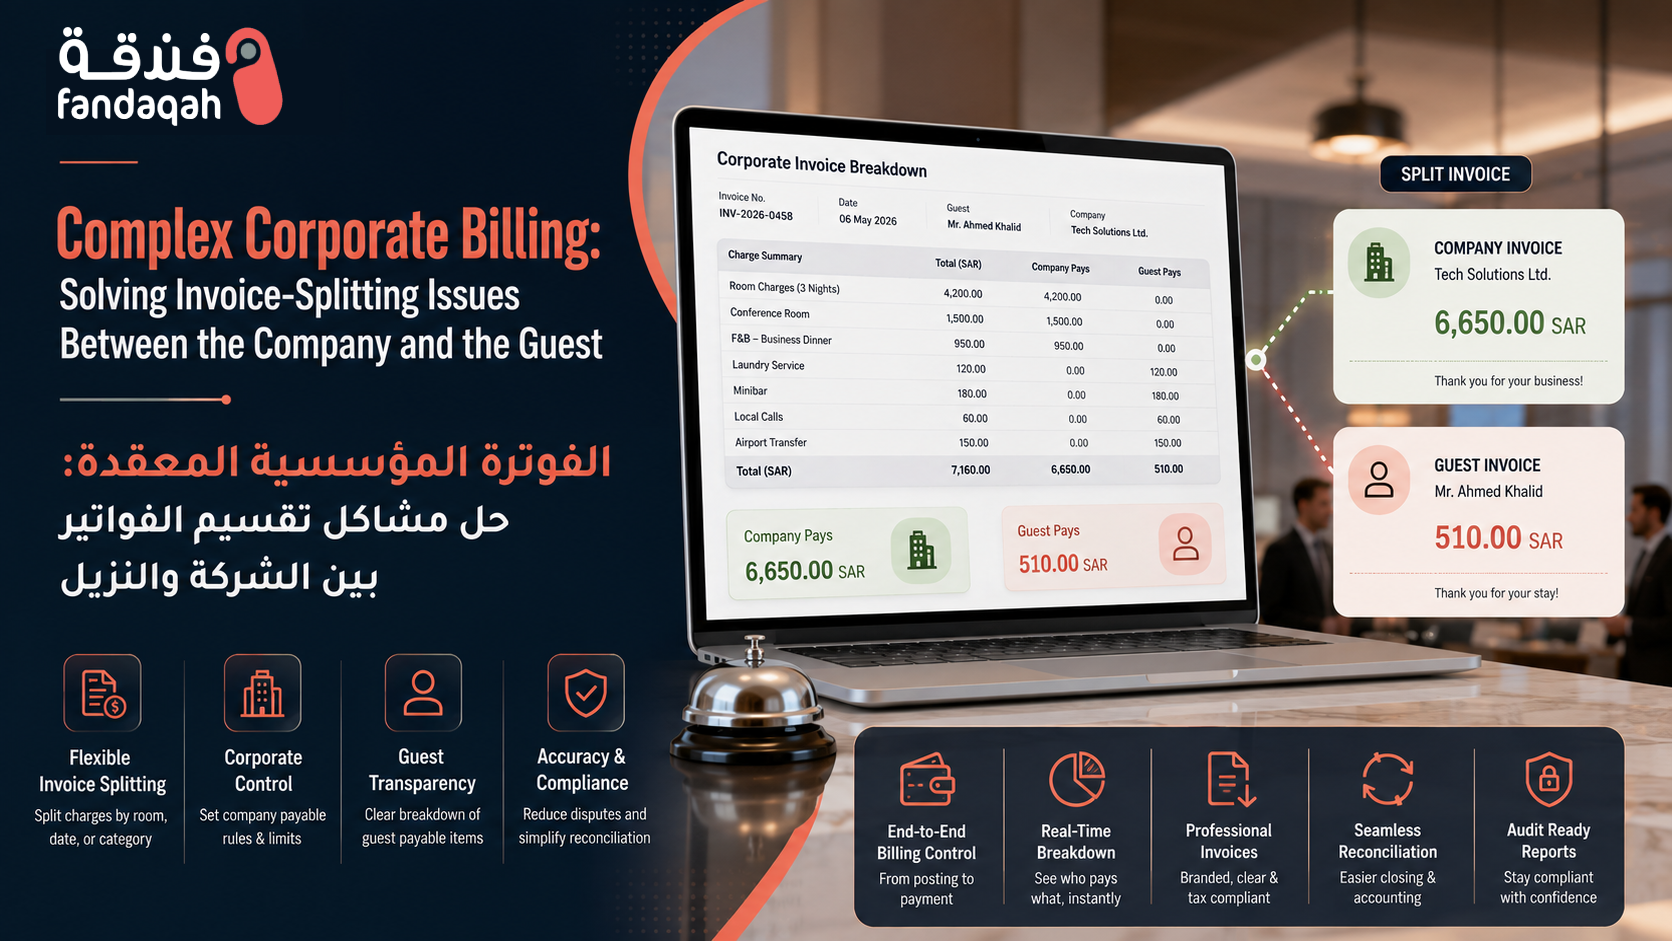
Master complex corporate billing & invoice splitting between company and guest. Automate ZATCA-compliant solutions for Saudi hotels & serviced apartments....
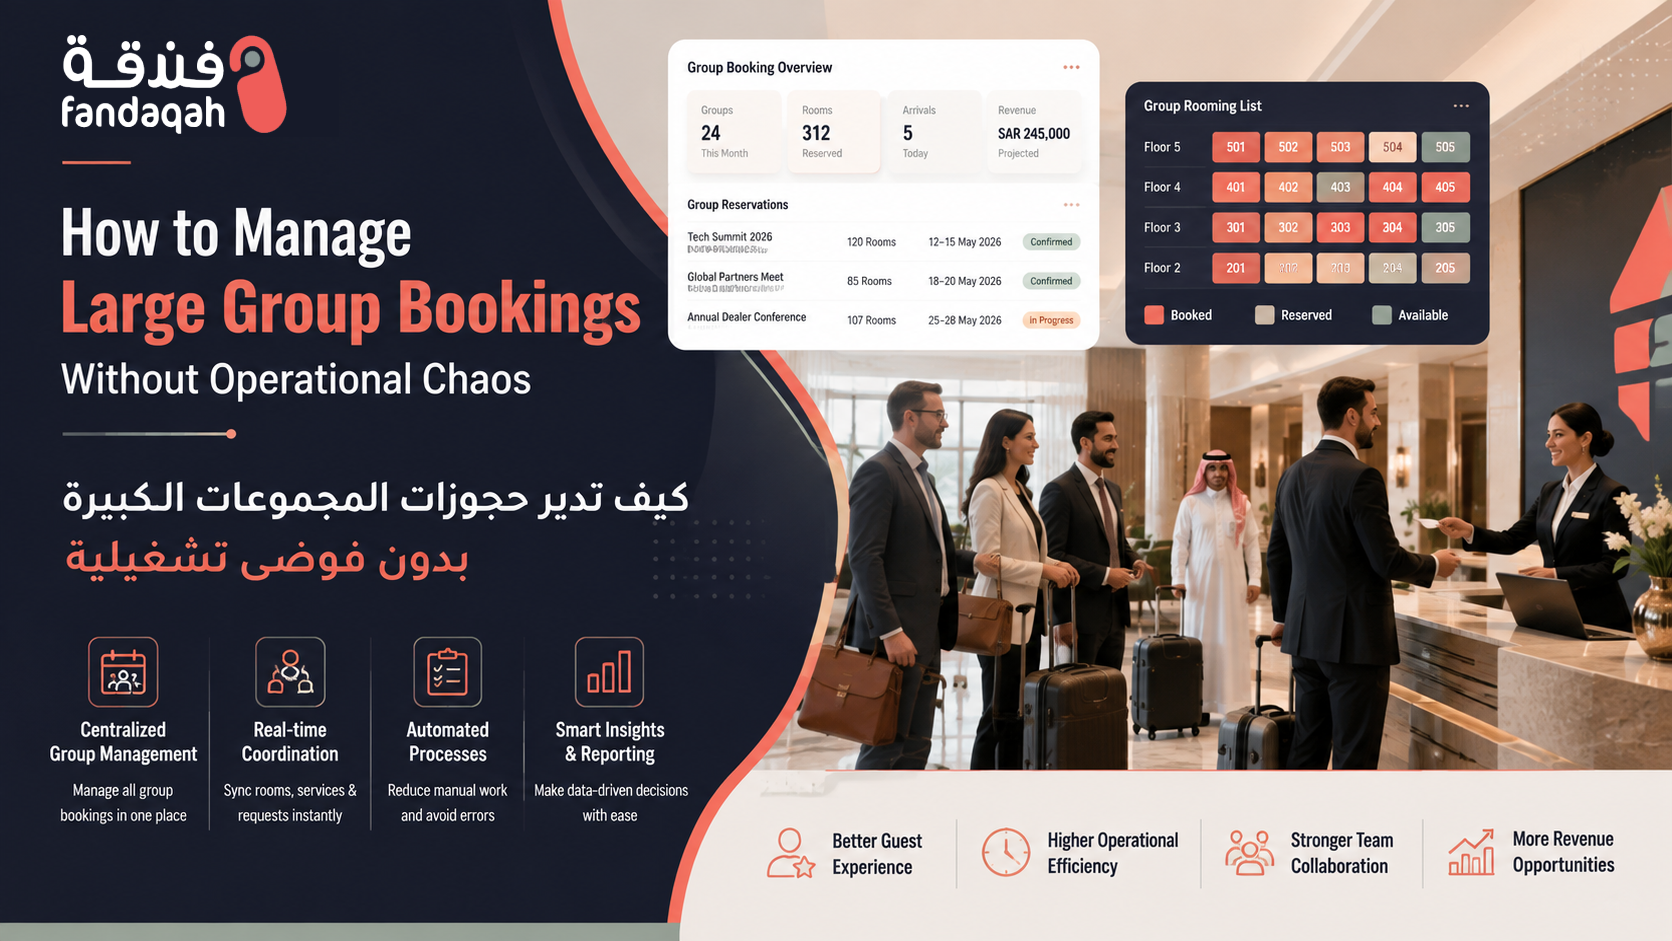
Master large group bookings in Saudi hospitality. Avoid operational chaos with proven strategies for hotels, restaurants & events during Hajj, Riyadh Season & Vision 2030....
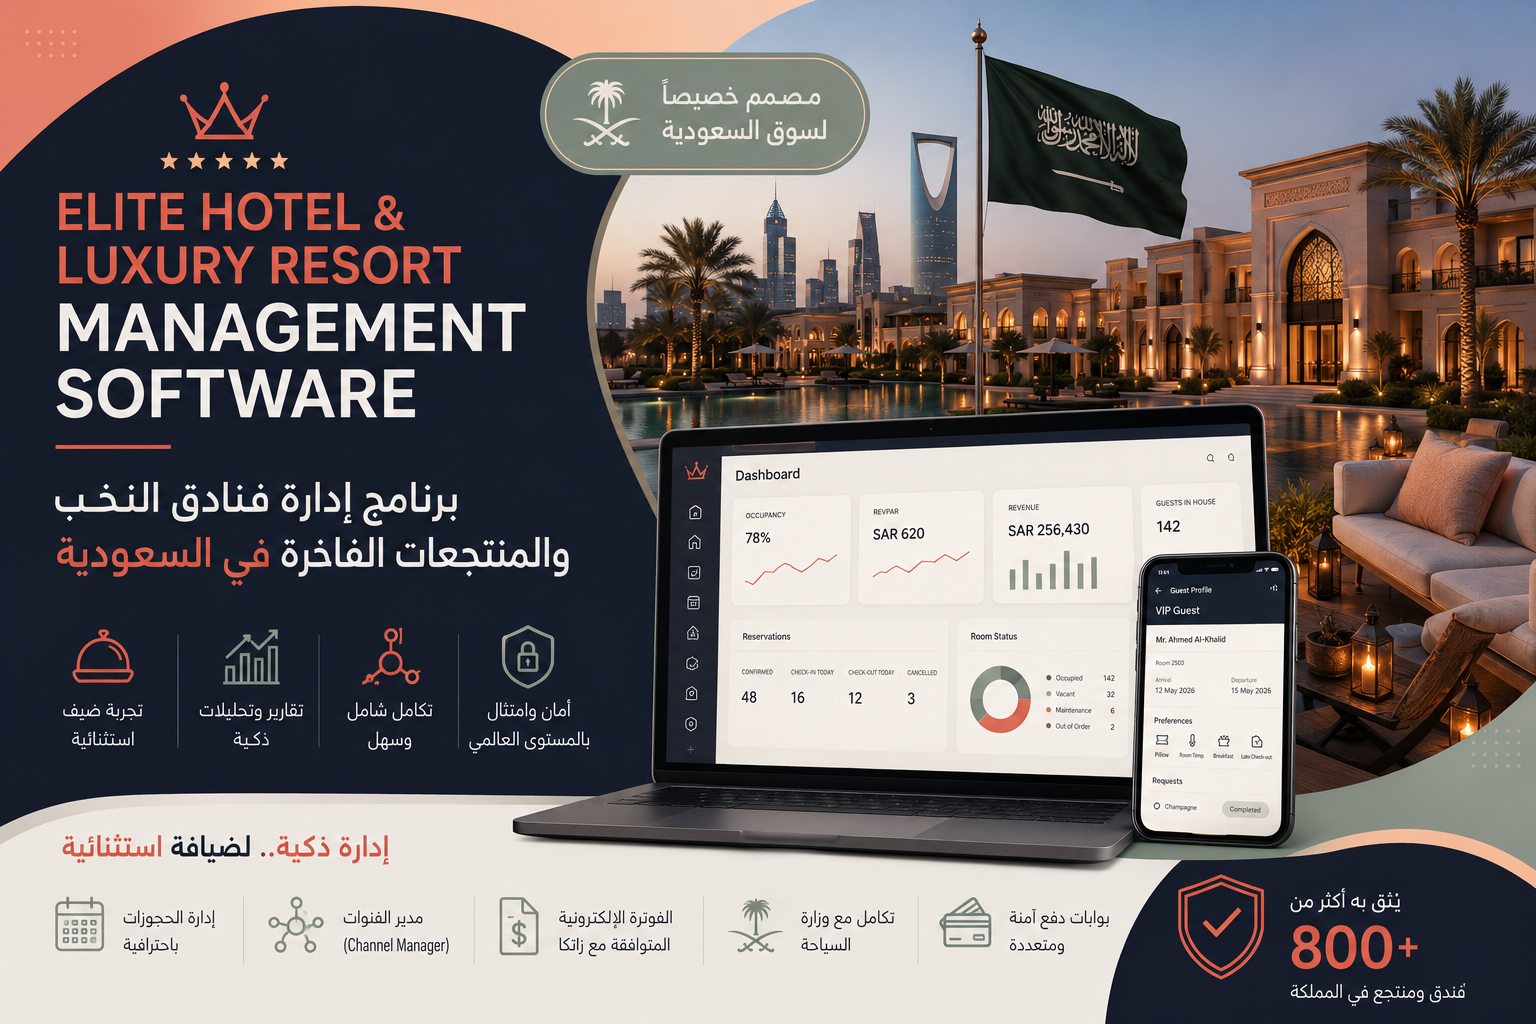
Discover the best cloud-based elite hotel & luxury resort management software (PMS) for Saudi Arabia. Boost guest experience, automate operations & align with Vision 2030....
Practical guide for independent boutique hotels in Saudi Arabia to compete with major chains on a limited budget. Leverage local hospitality, organic SEO/GEO, Vision 2030 opportunities, and smart part...
Explore the rise of AI receptionists in hotels. This expert analysis compares AI to human front desks, examining benefits, drawbacks, and the future of hospitality. Discover if AI is truly better for ...

Unlock the secrets to a fully booked hotel. Discover 50 actionable marketing ideas, from local SEO to immersive virtual tours, designed to skyrocket your bookings and boost revenue....
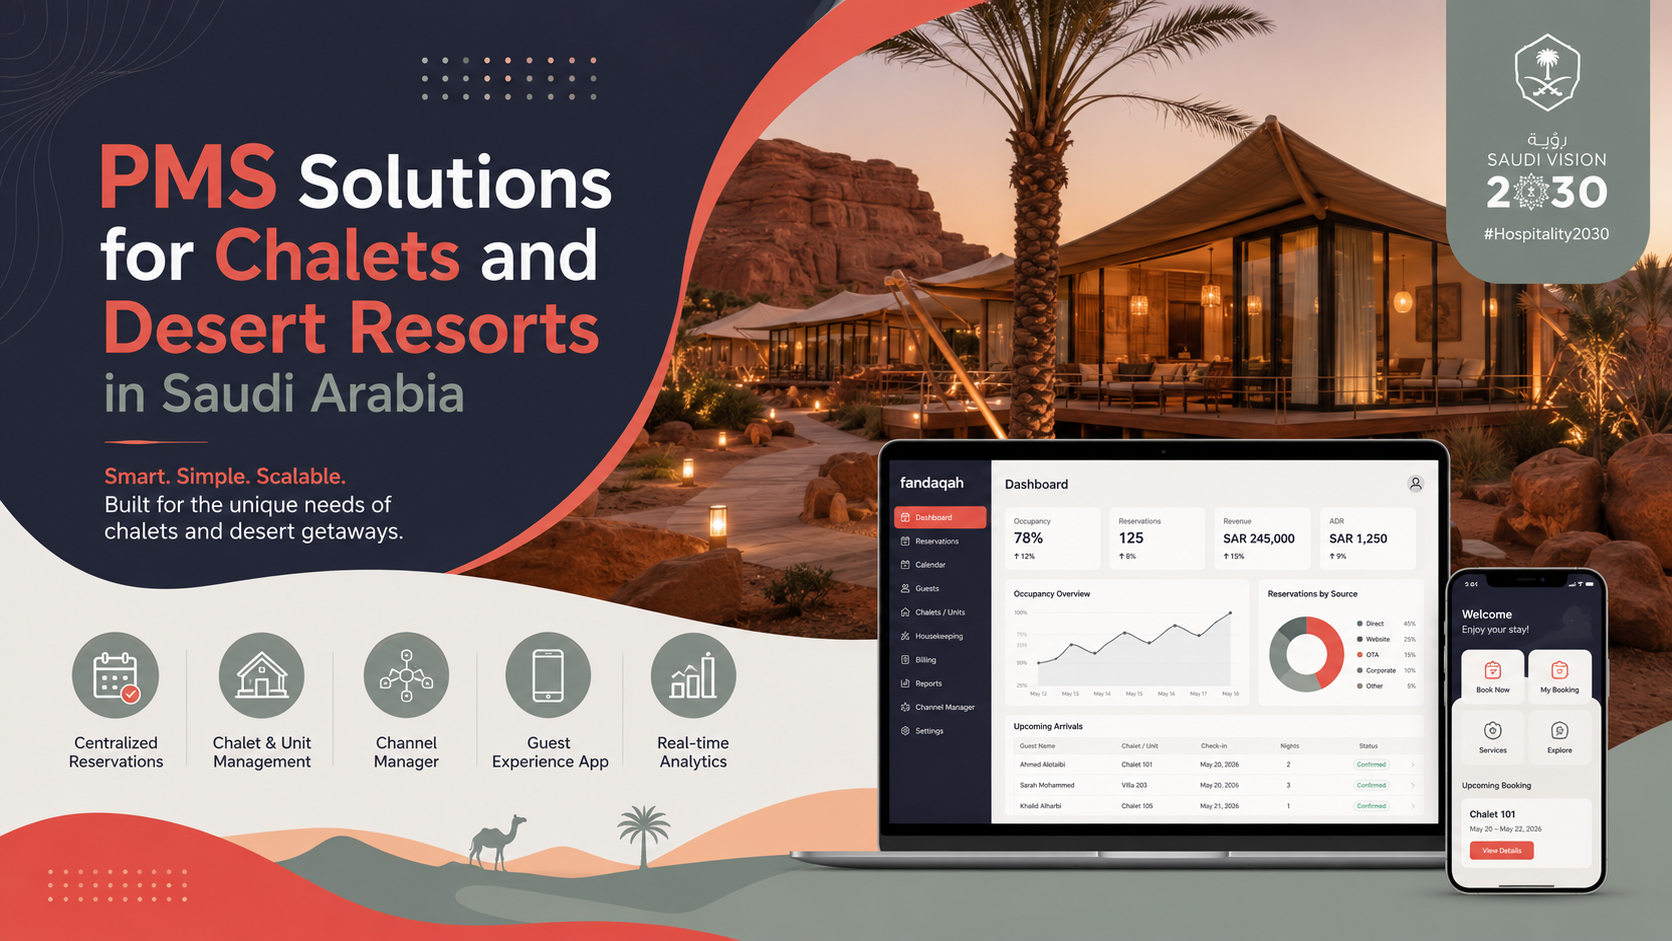
Discover how a modern PMS transforms chalet and desert resort management in Saudi Arabia. Boost bookings, automate operations, and align with Vision 2030 tourism goals....
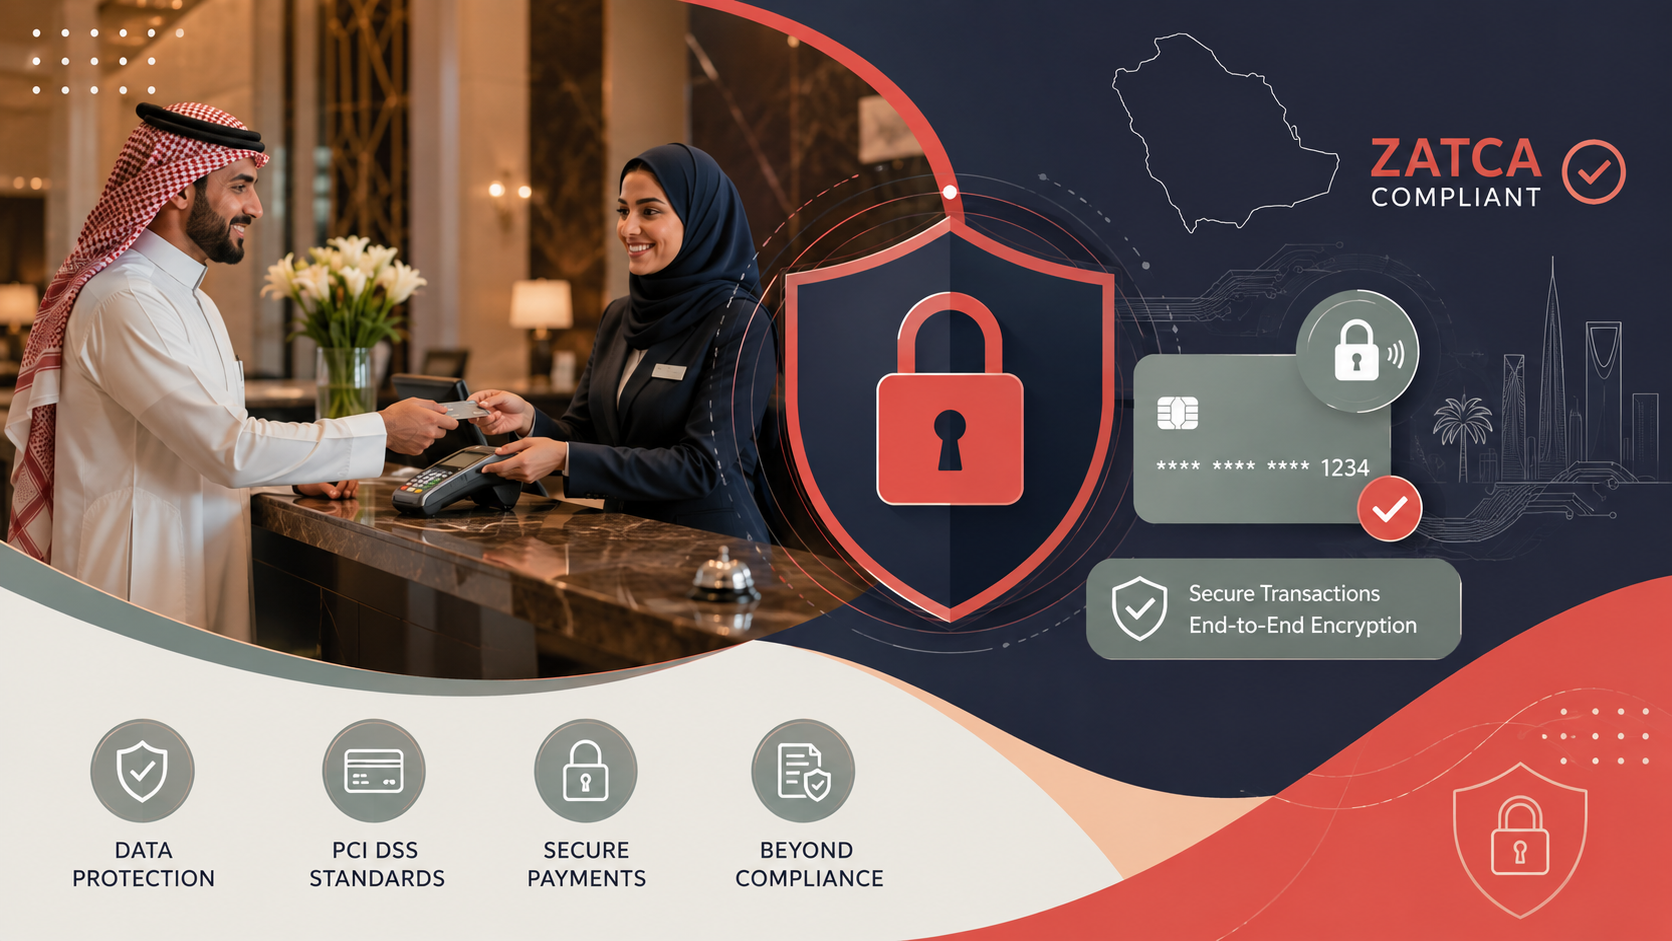
ZATCA e-invoicing alone isn’t enough. Learn how Saudi hotels can secure guest payment data with PCI DSS, NCA controls, and Vision 2030-aligned strategies to prevent breaches and build trust....
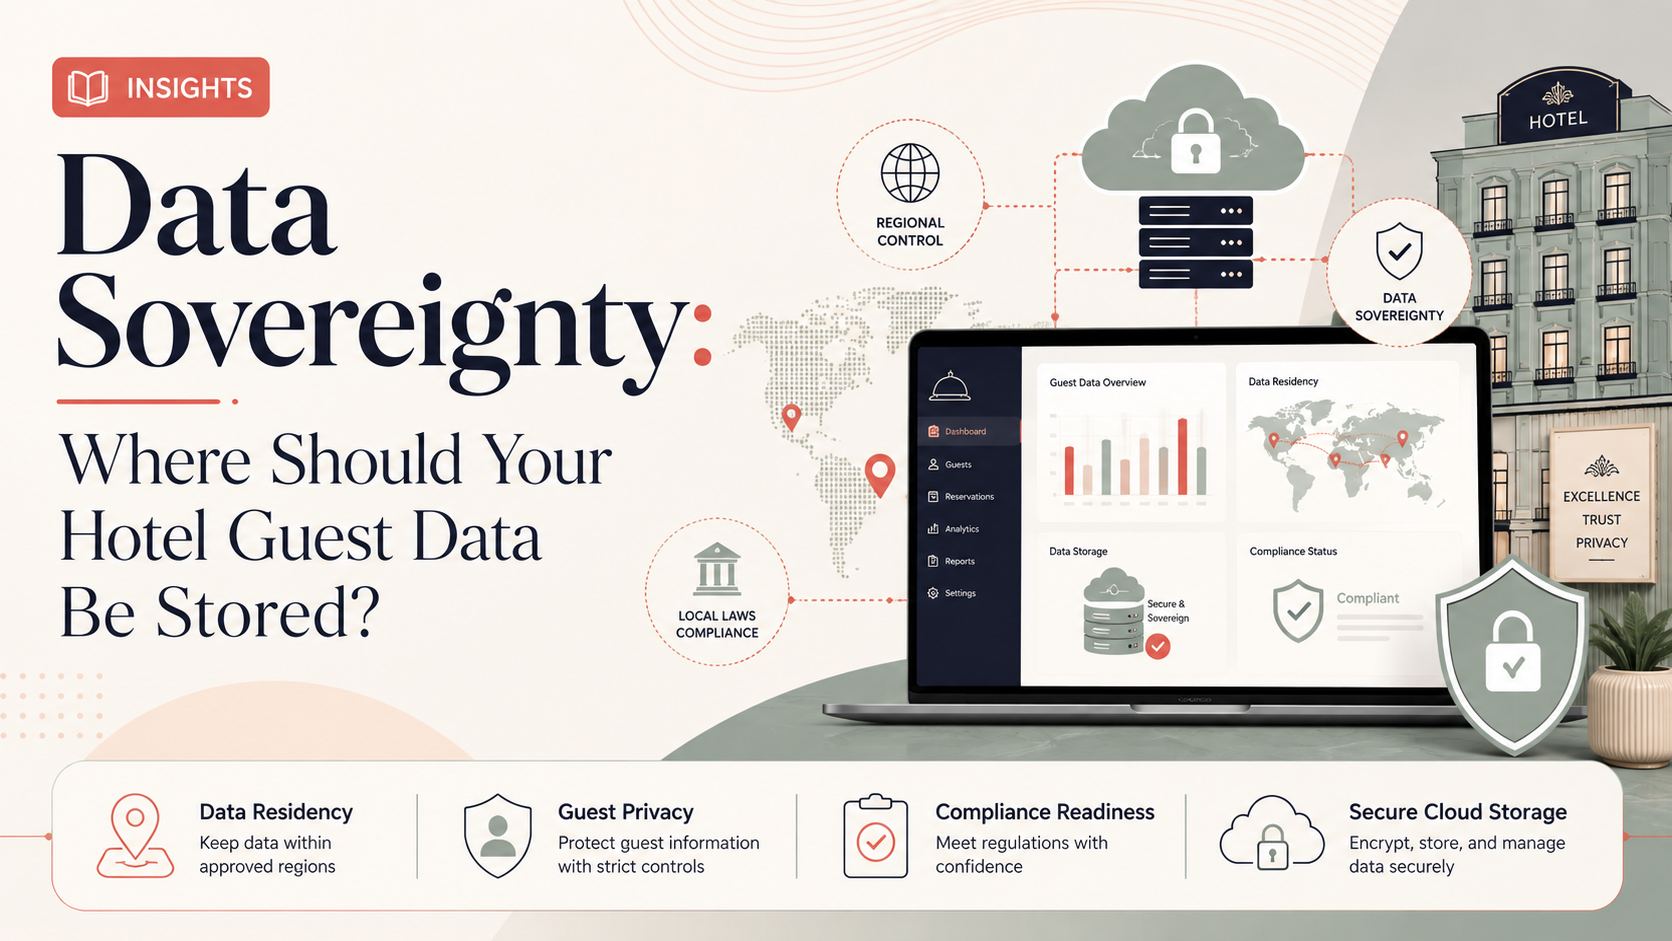
Where should Saudi hotels store guest data? A practical guide to data sovereignty, PDPL compliance, local cloud storage, and protecting privacy under Vision 2030....
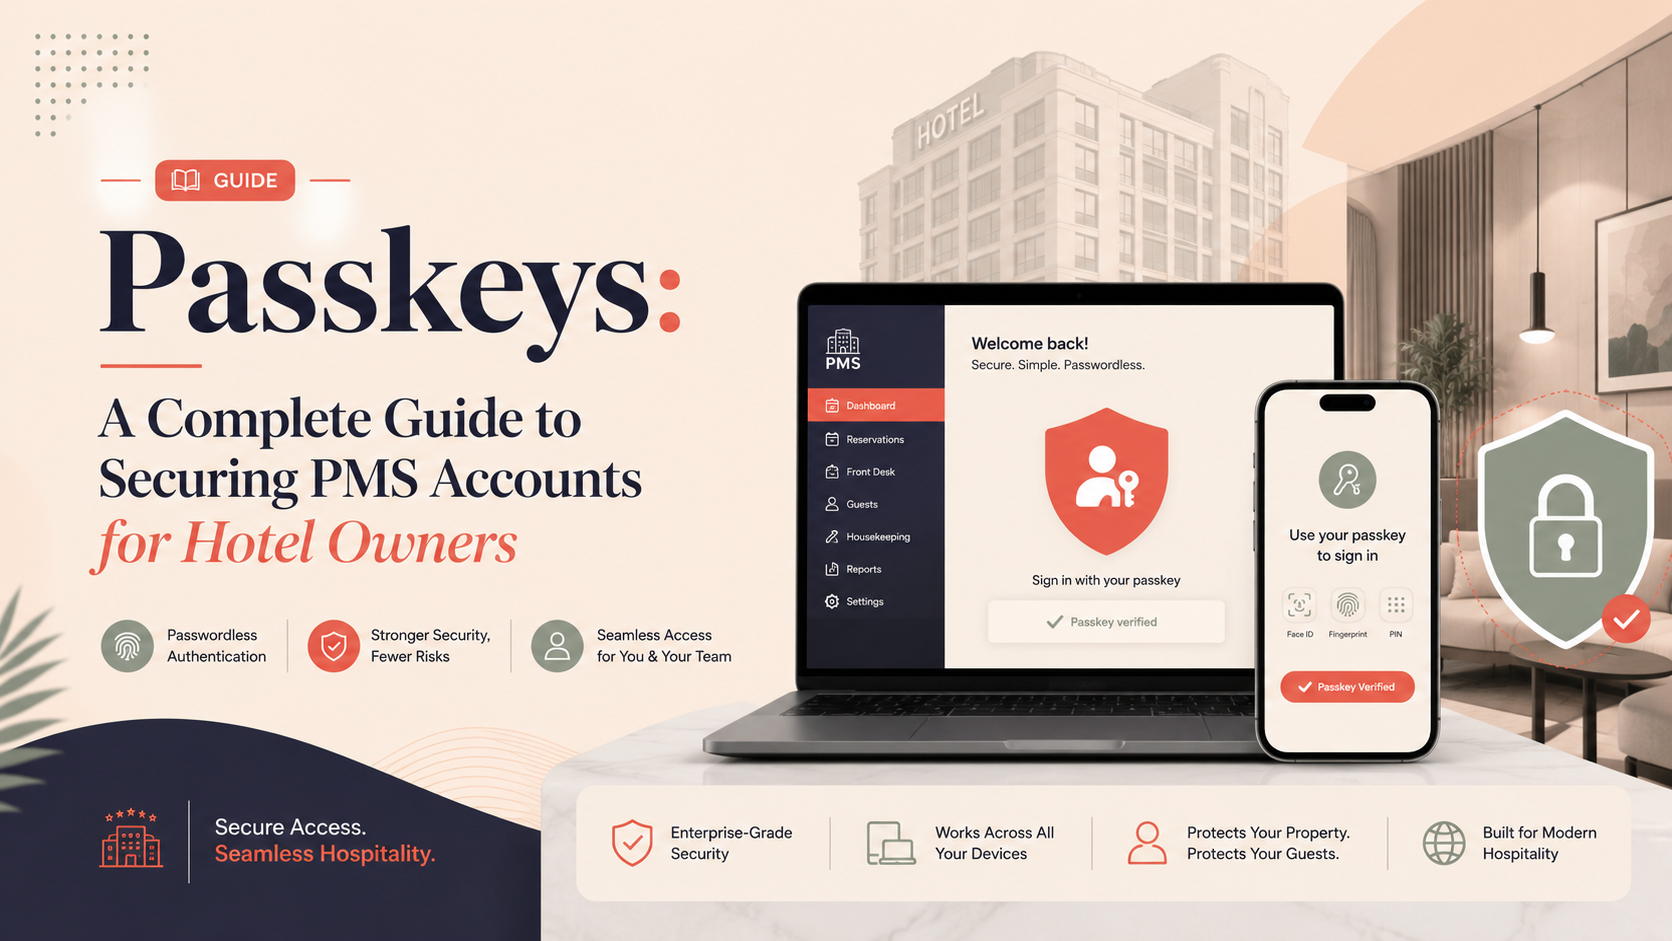
Secure hotel PMS accounts with passkeys. A practical guide for Saudi hotel owners on passwordless, phishing-resistant authentication, implementation, and recovery....

Learn how Saudi hotels can cut energy, water, and food waste costs while aligning with Vision 2030. Practical steps, KPIs, and a clear sustainability plan for better profits and guest experience....
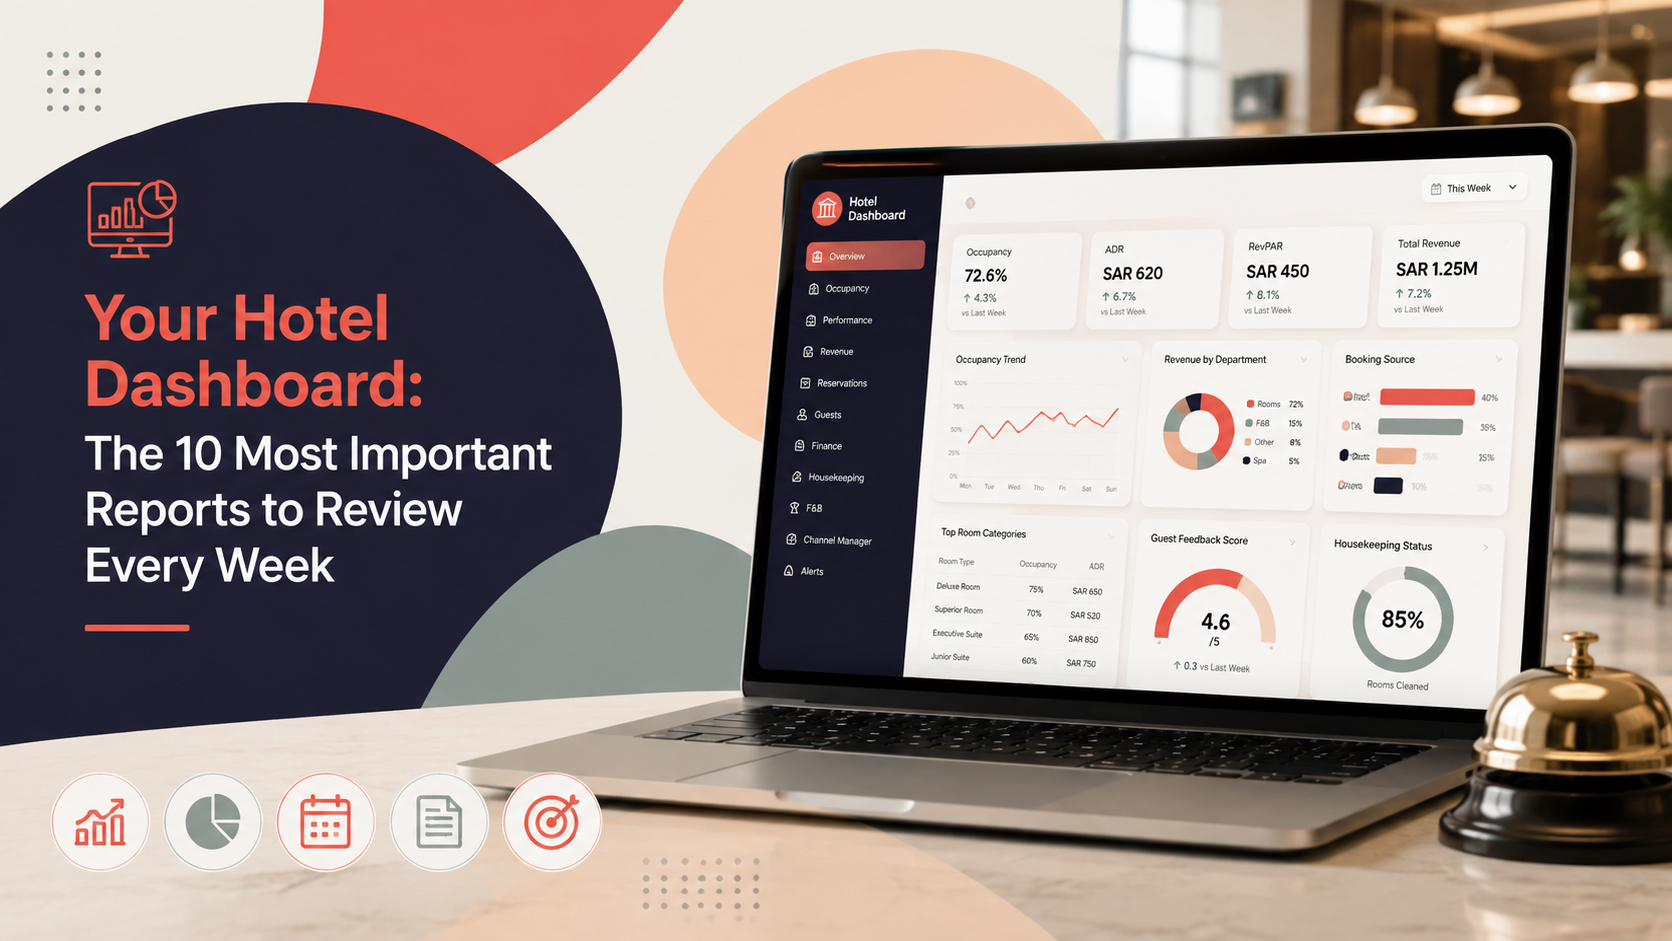
Discover the 10 essential hotel dashboard reports to review every week—occupancy, ADR, RevPAR, booking pace, channels, guest satisfaction & more—to boost revenue and performance in Saudi Arabia....
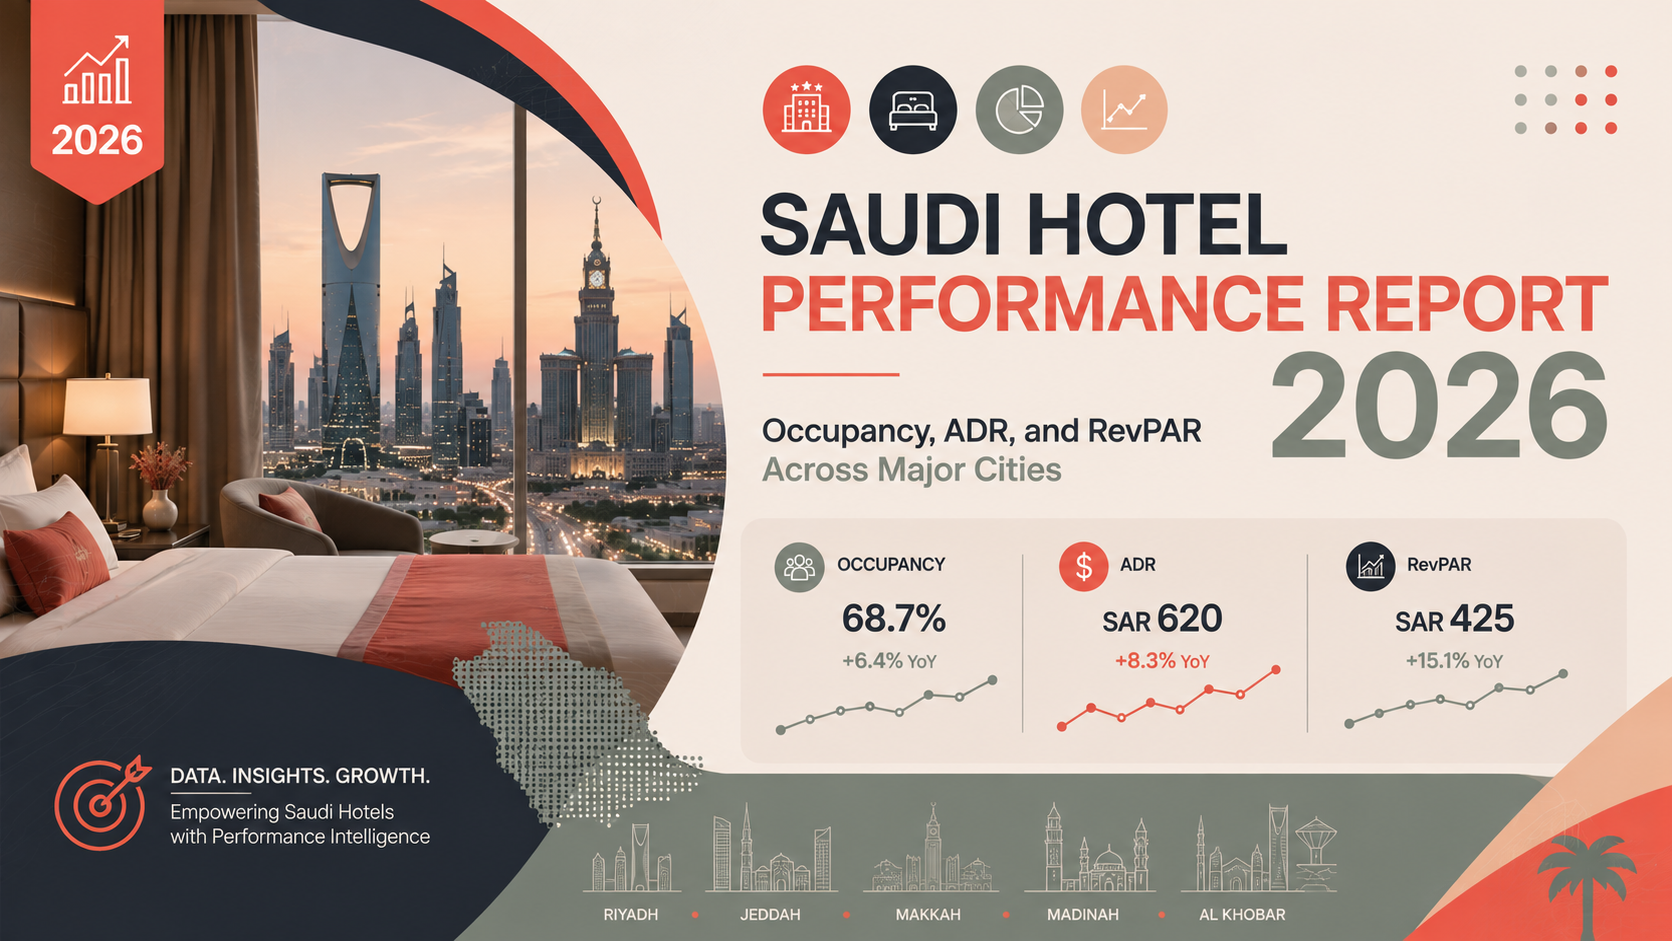
Discover the Saudi Hotel Performance Report 2026 with projected occupancy, ADR, and RevPAR for Riyadh, Jeddah, Makkah, Madinah, Dammam, and AlUla. Key insights for investors and operators aligned with...
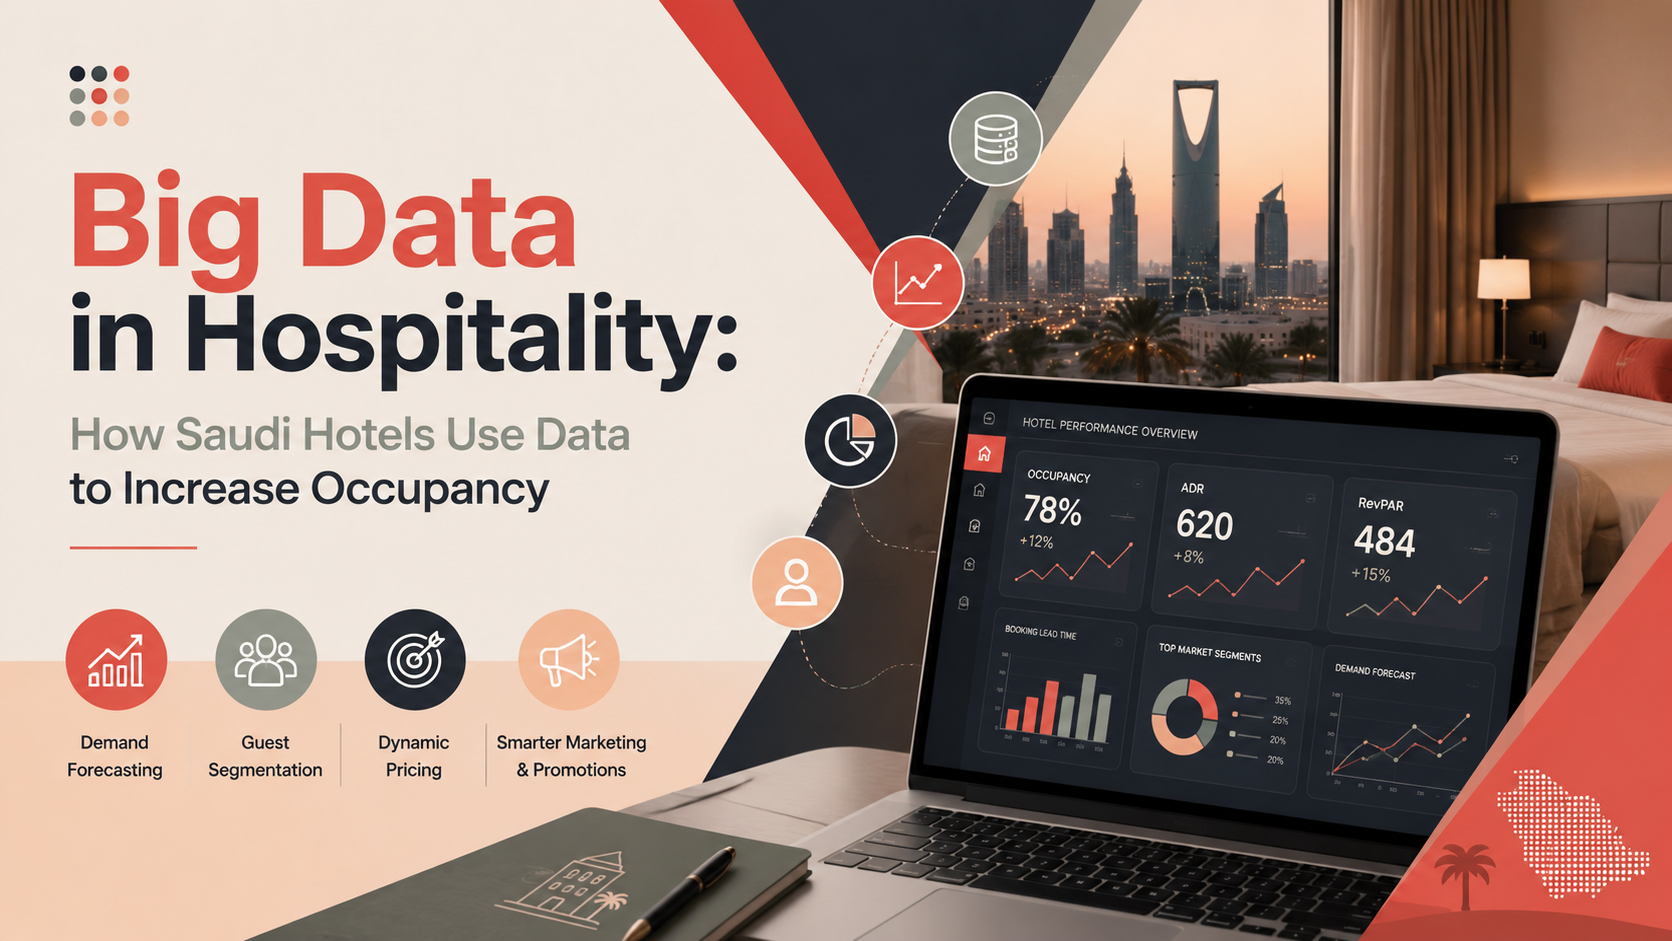
Discover how Saudi hotels use big data analytics, dynamic pricing, and predictive tools to increase occupancy, raise RevPAR, and support Vision 2030 tourism goals....
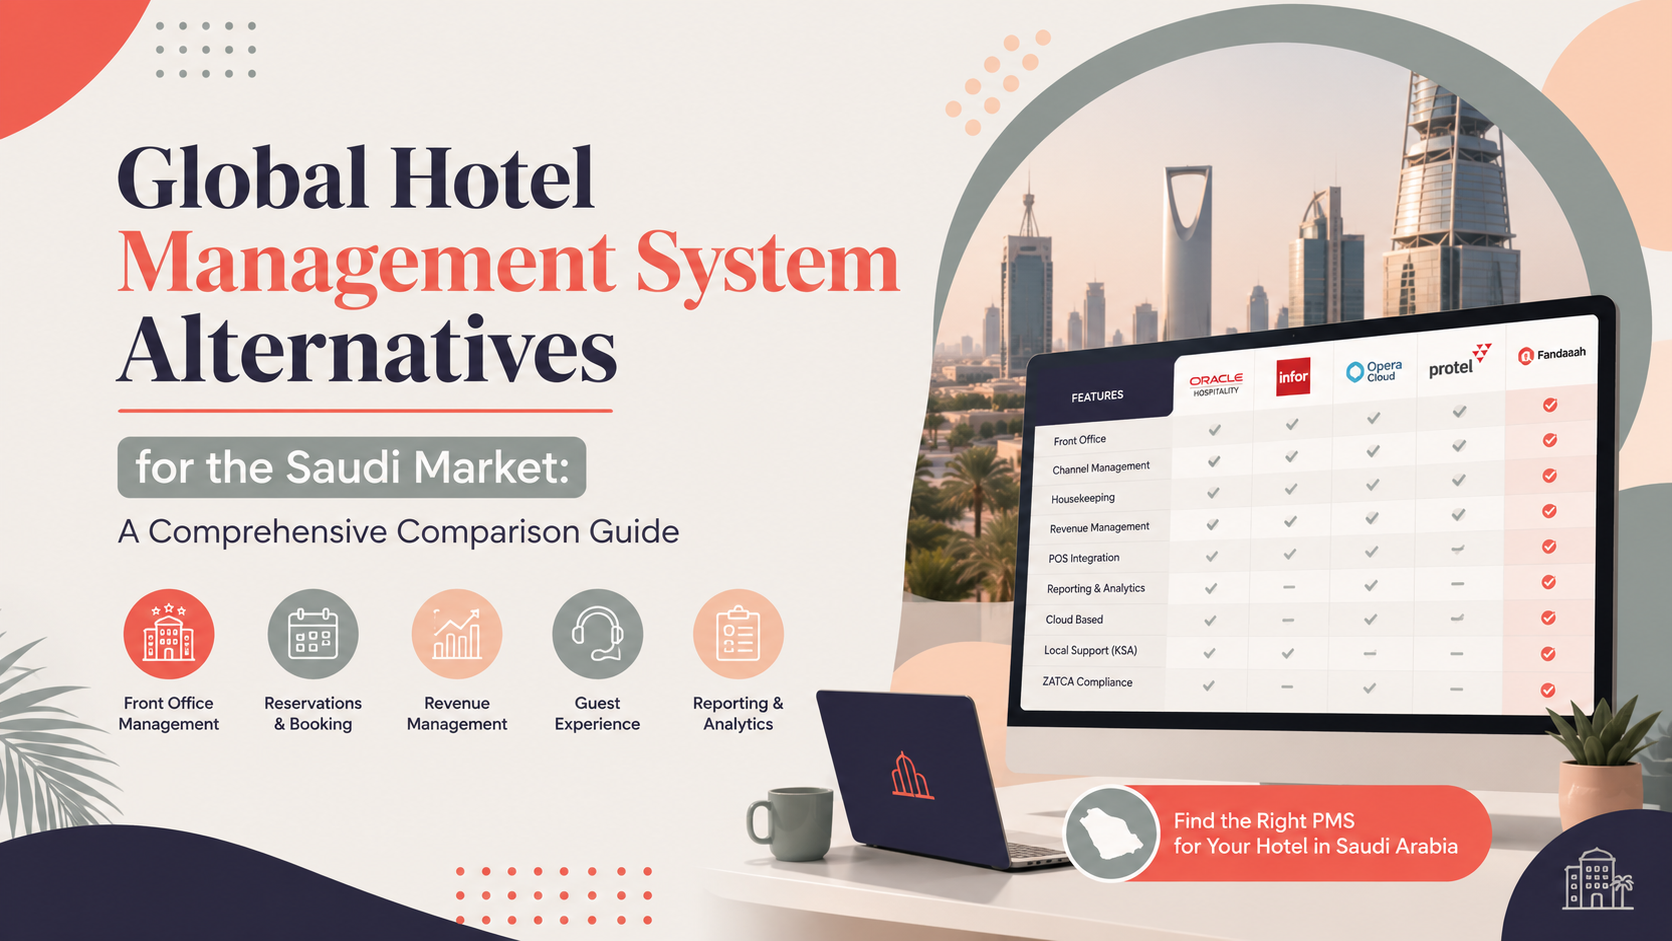
Compare the best hotel management system alternatives for Saudi hotels. Cloudbeds, Mews, Deyafa & more with full Fatoorah e-invoicing support, Arabic UI & Vision 2030 readiness....
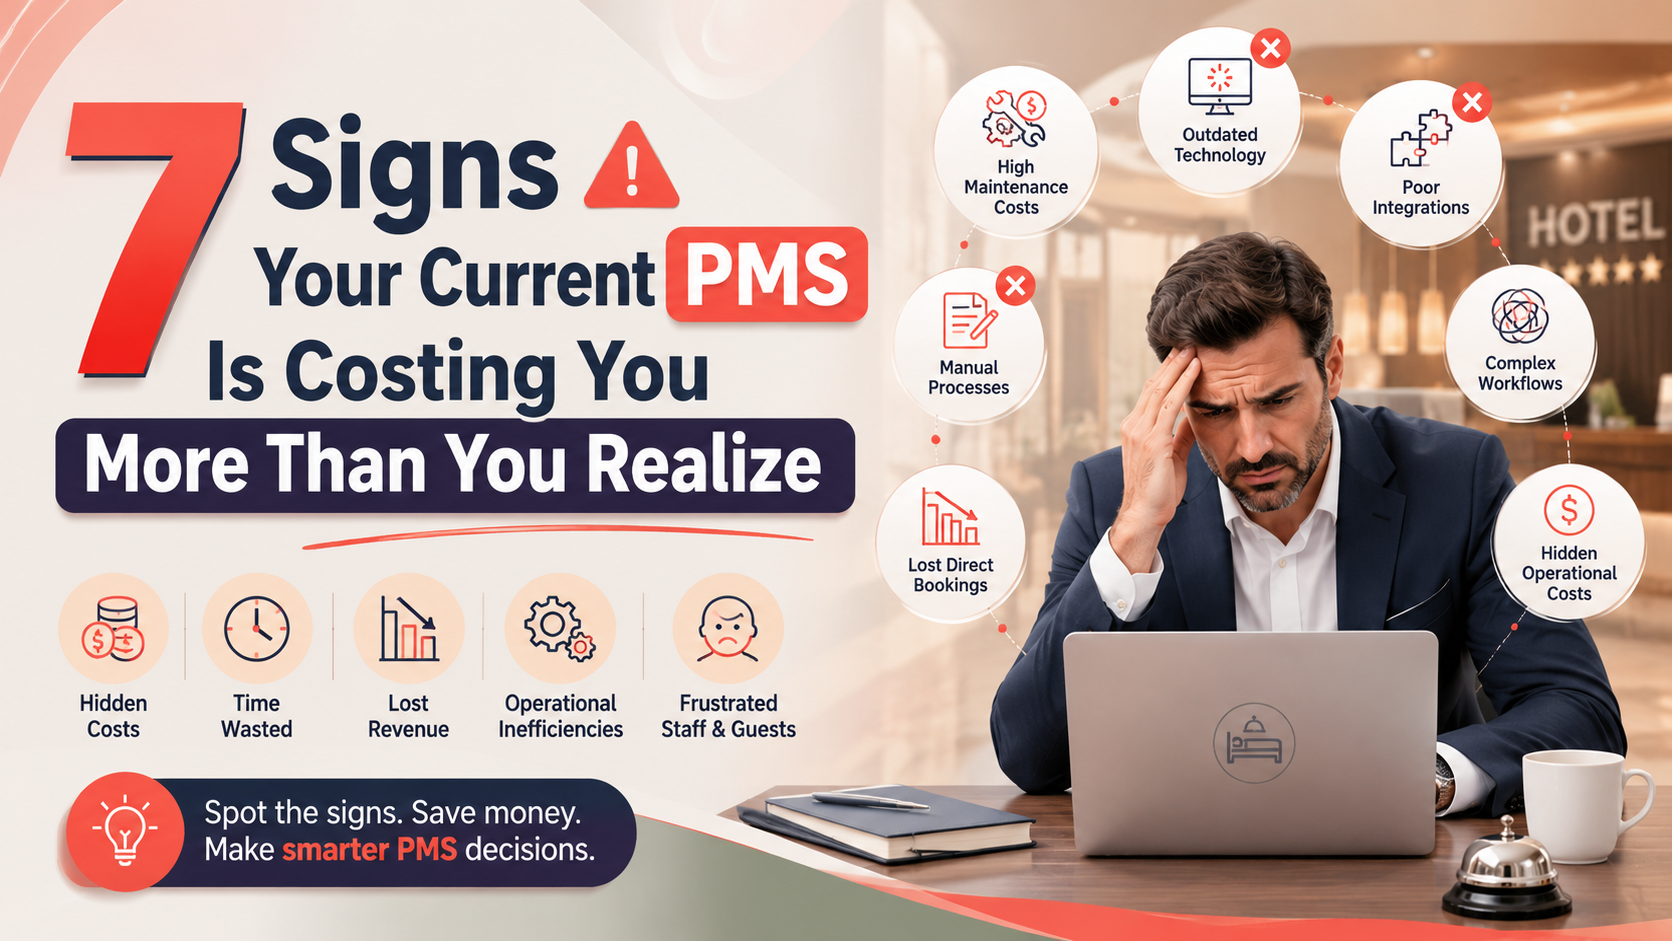
Discover 7 warning signs your current hotel PMS is silently draining profits. Learn how upgrading boosts revenue, cuts costs & ensures Dyafa compliance in Saudi Arabia....
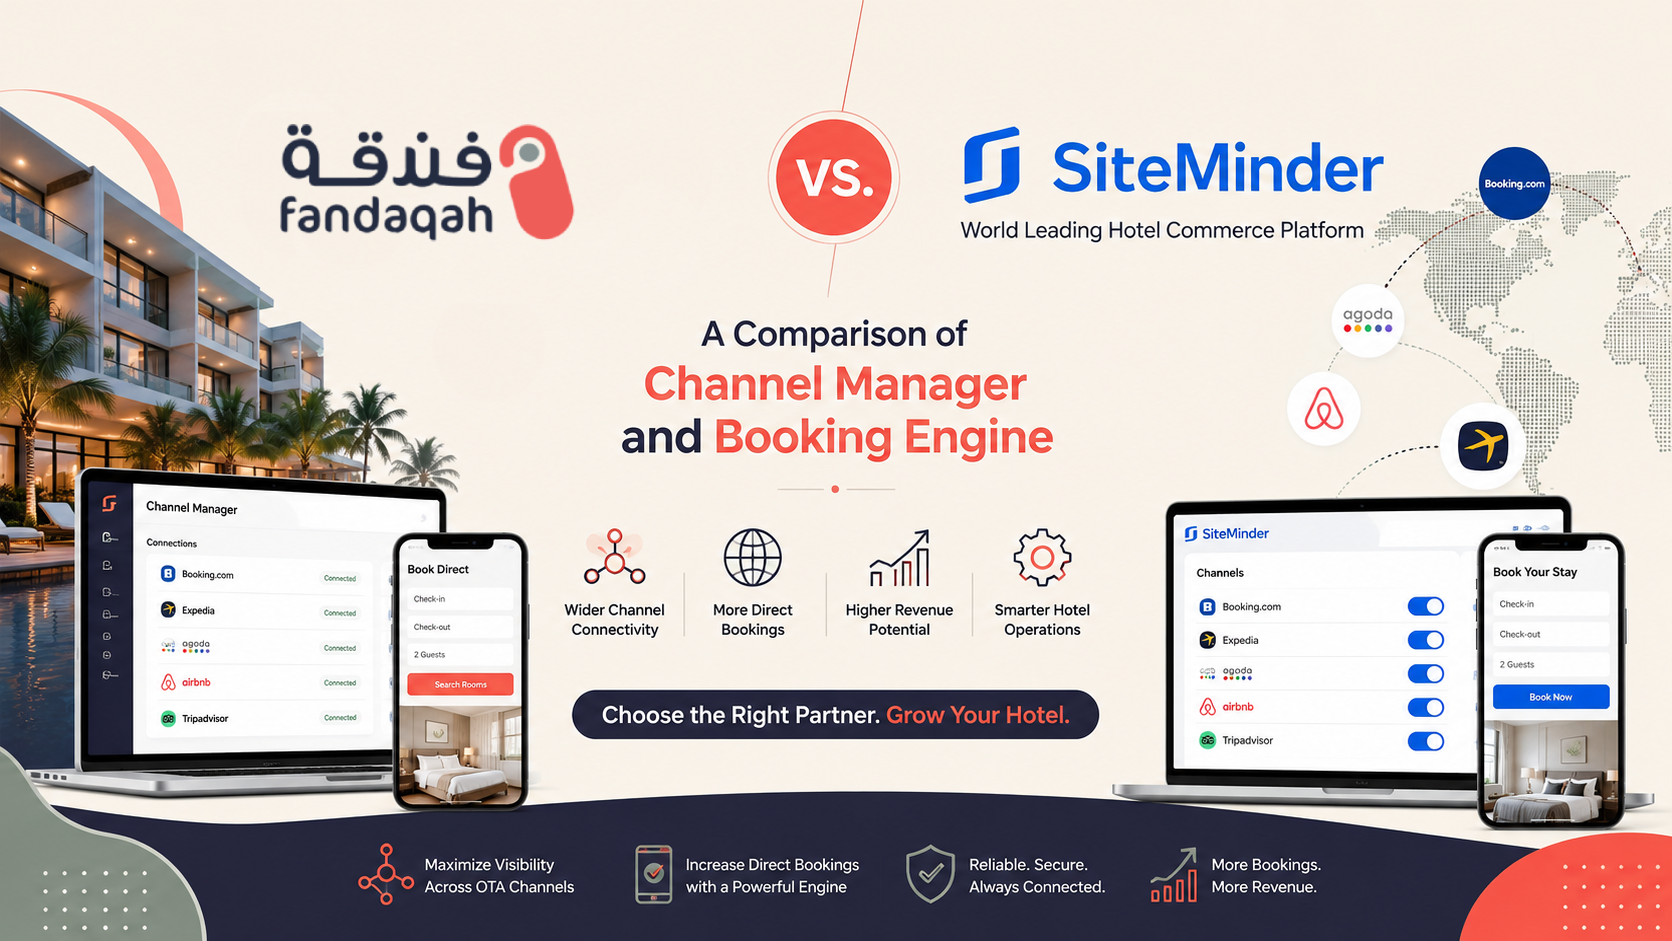
Compare Fandaqah vs SiteMinder for Saudi hotels. Discover which channel manager & booking engine wins on Arabic support, local OTAs, Mada payments, pricing & Vision 2030 fit....
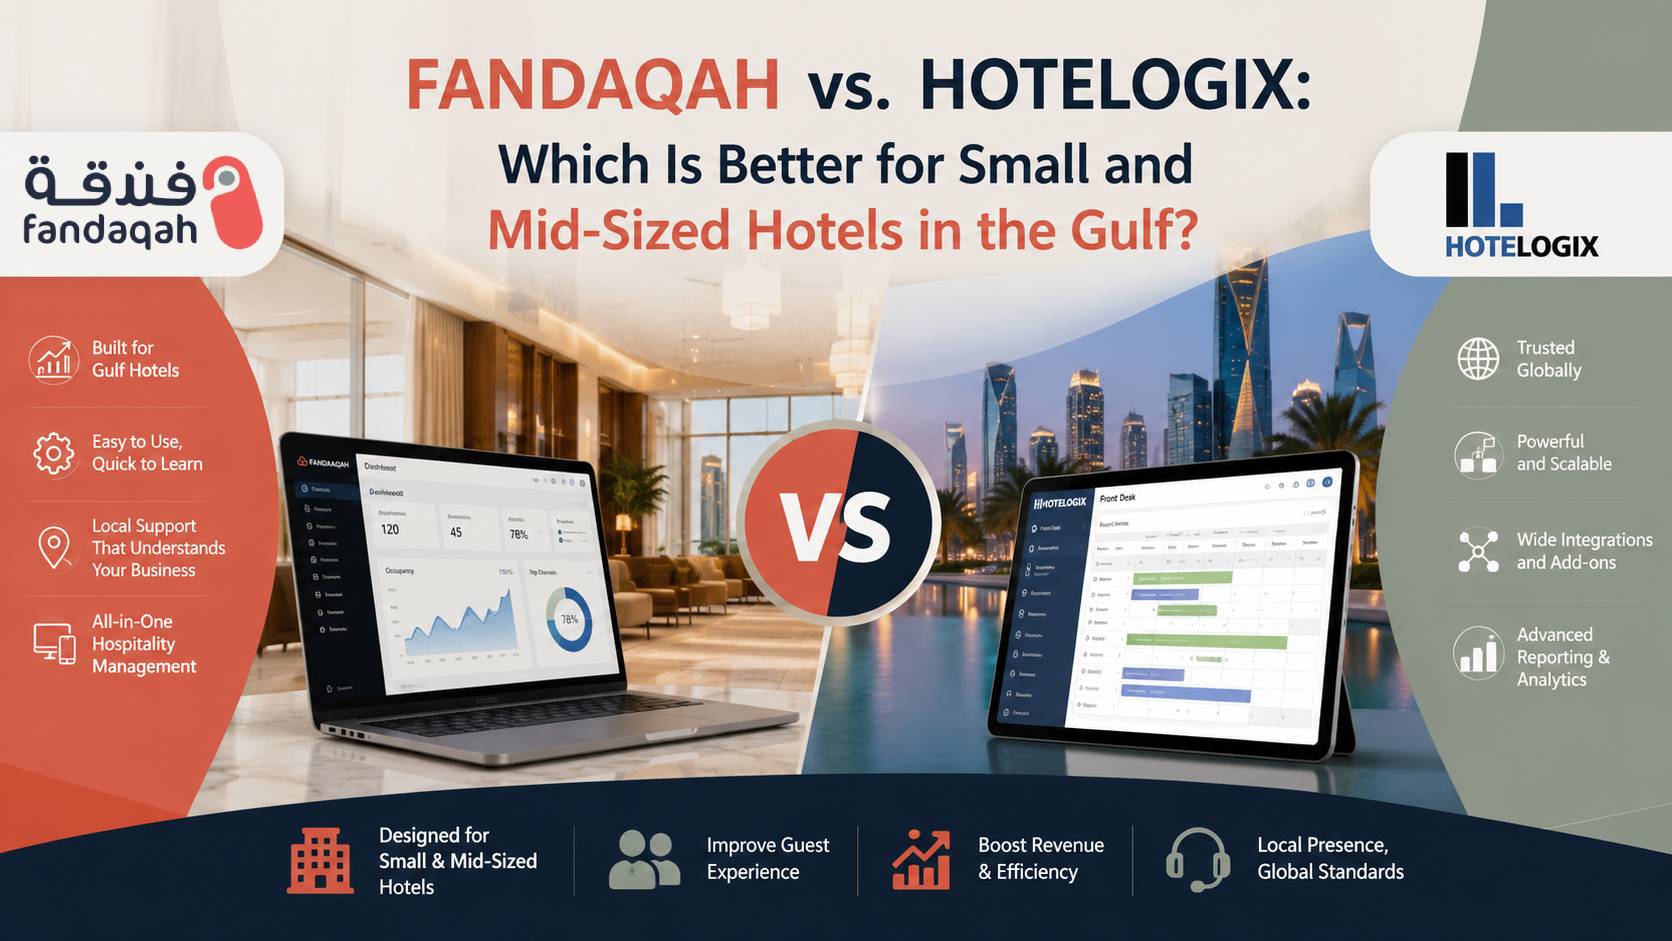
Compare Fandaqah and Hotelogix for small & mid-sized hotels in Saudi Arabia and the Gulf. Arabic-first PMS, ZATCA compliance, local payments & more....
Ready-to-use PMS Request for Proposal (RFP) template for Saudi hotels. Compare vendors, define requirements, integrations, security & implementation for smarter hotel software selection....
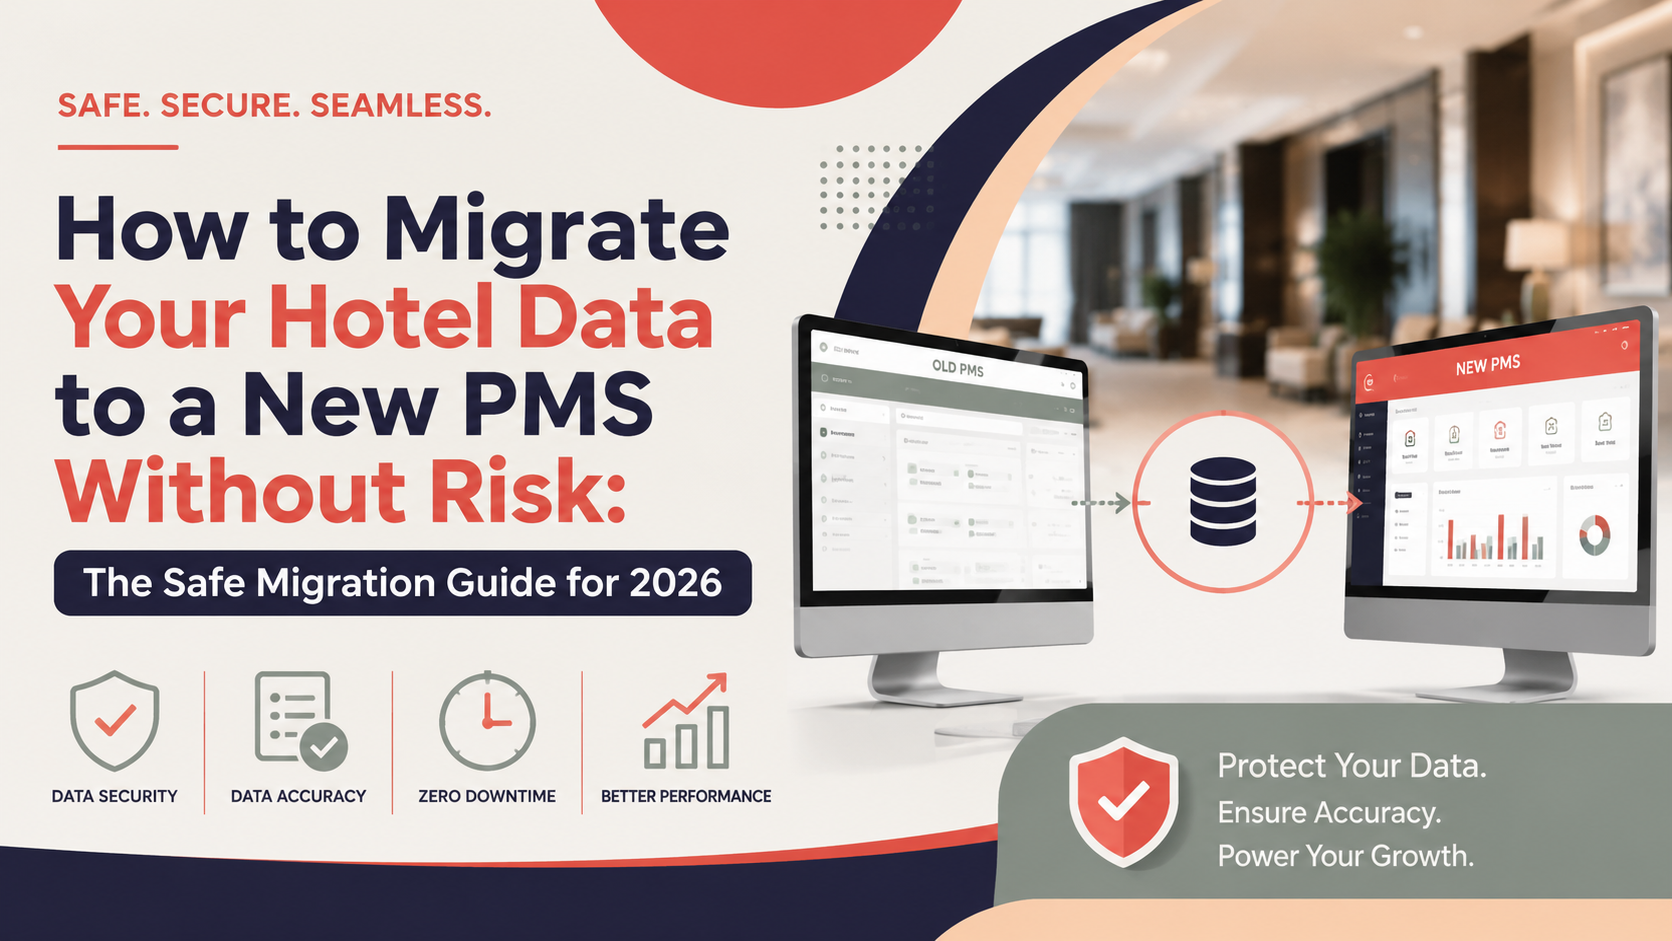
Learn how to migrate your hotel data to a new PMS without risk. Discover the 2026 step-by-step migration checklist for Saudi hotels, including testing, security, and successful go-live planning....
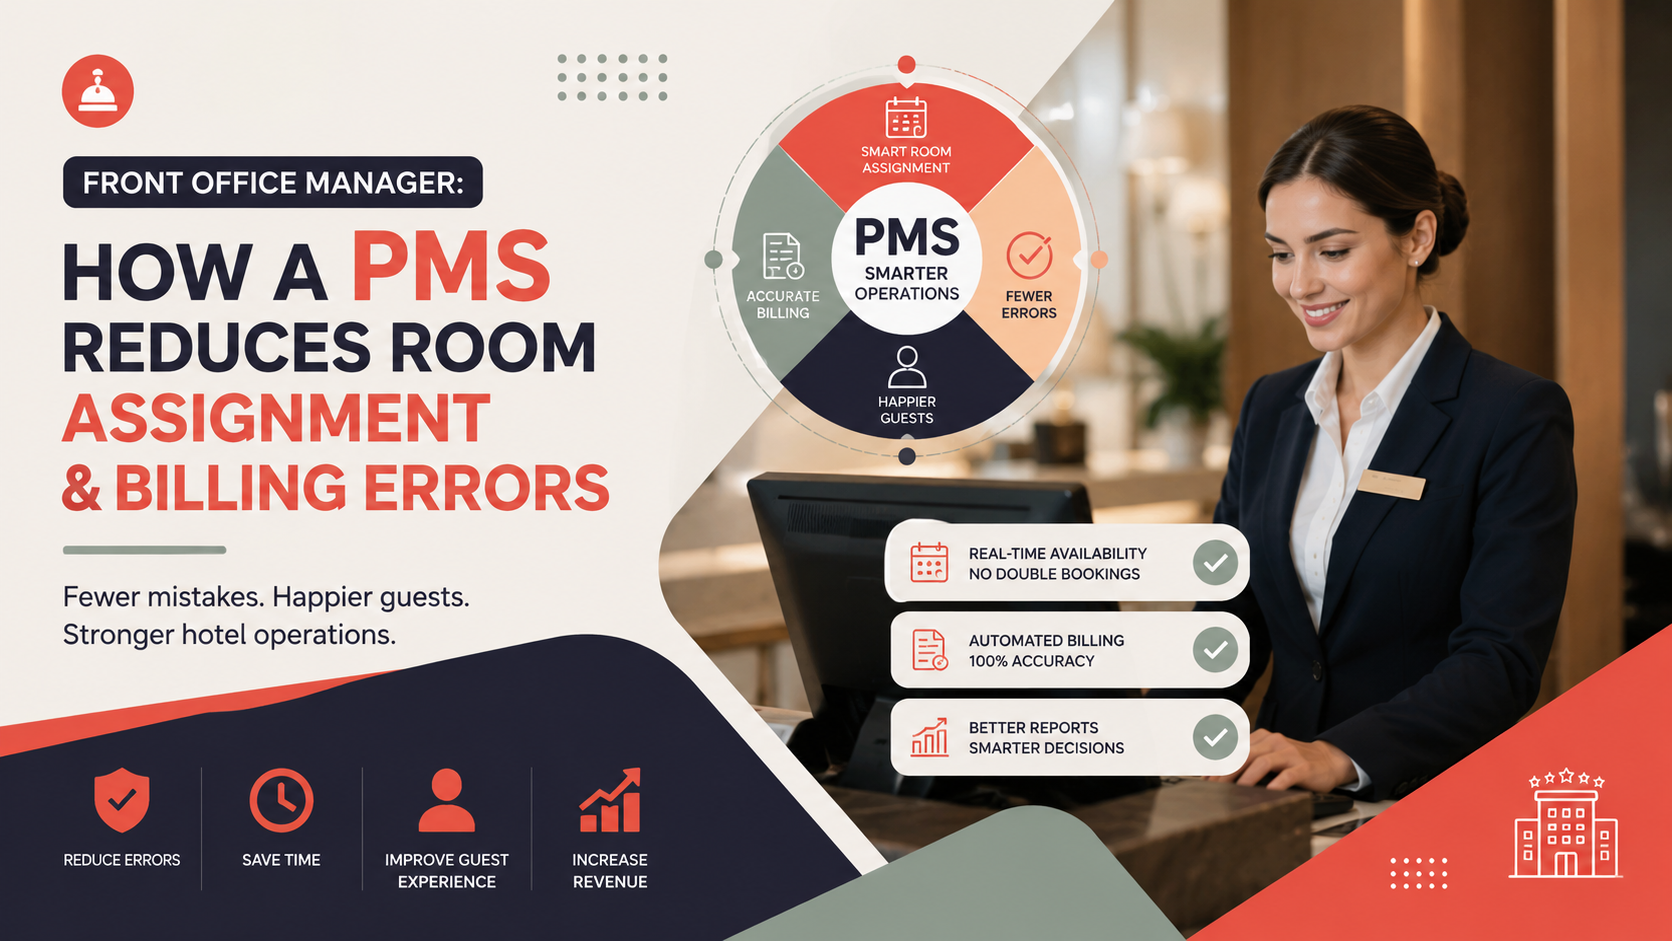
Learn how a hotel PMS helps front office managers prevent room assignment mistakes, reduce billing errors, and improve guest satisfaction in Saudi hotels....

Learn how hotel sales managers in Saudi Arabia win corporate contracts and conference business with smarter outreach, pricing, and partnerships....
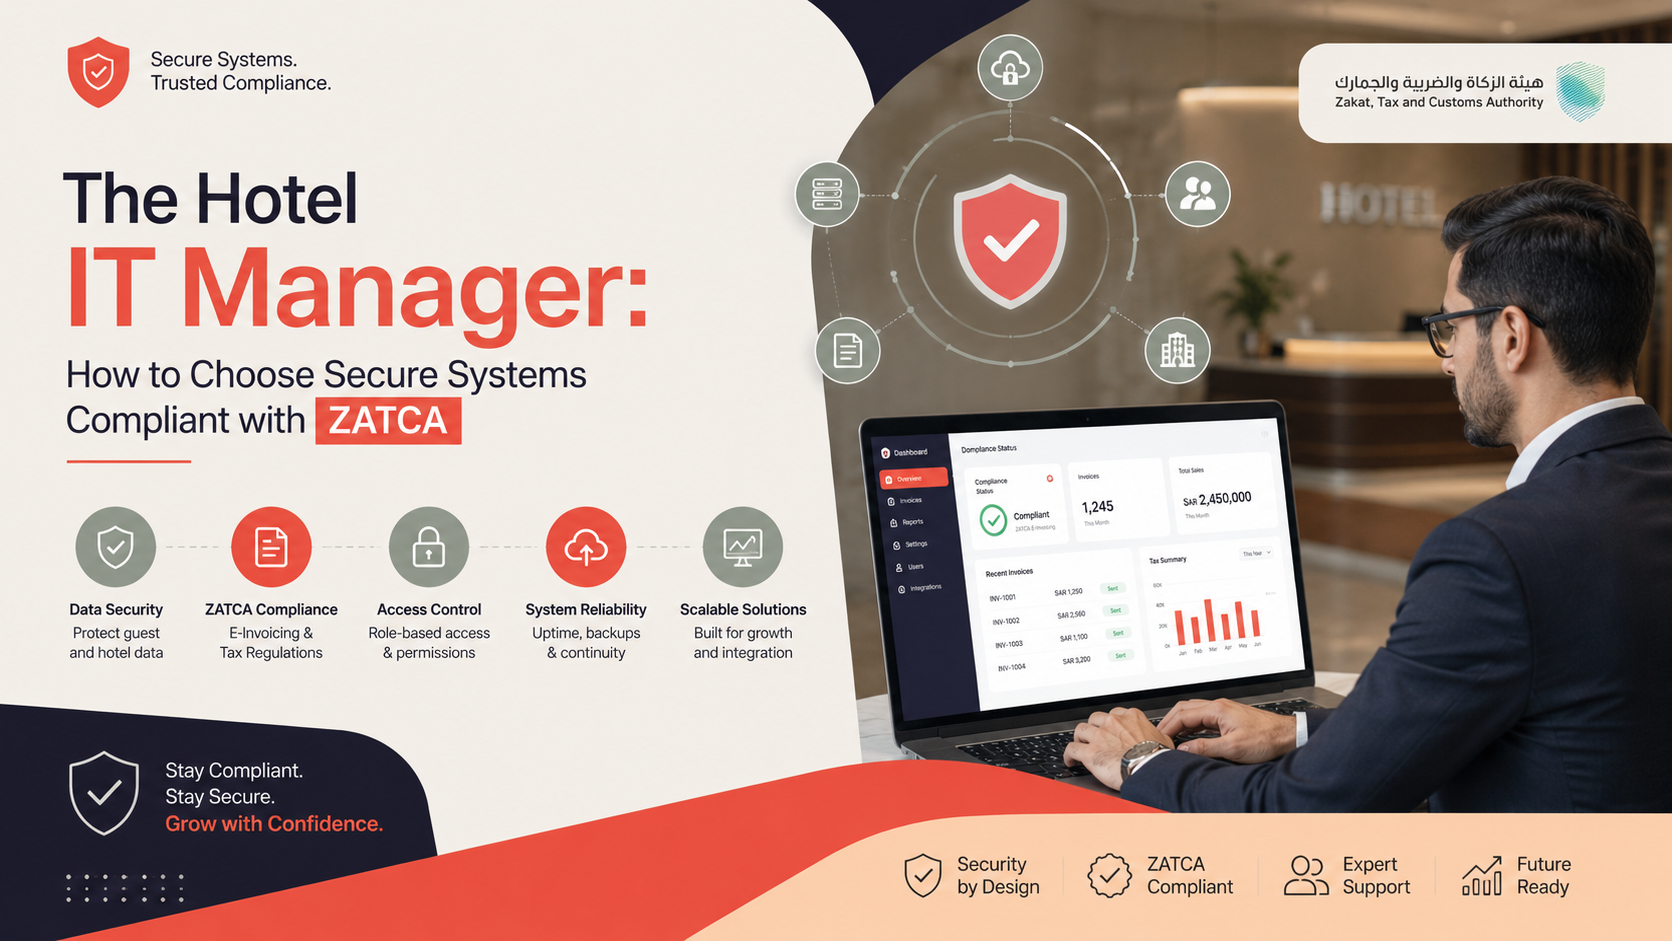
Learn how hotel IT managers choose secure, ZATCA-compliant systems, protect guest data, and ensure seamless PMS, POS, and e-invoicing integration. ...
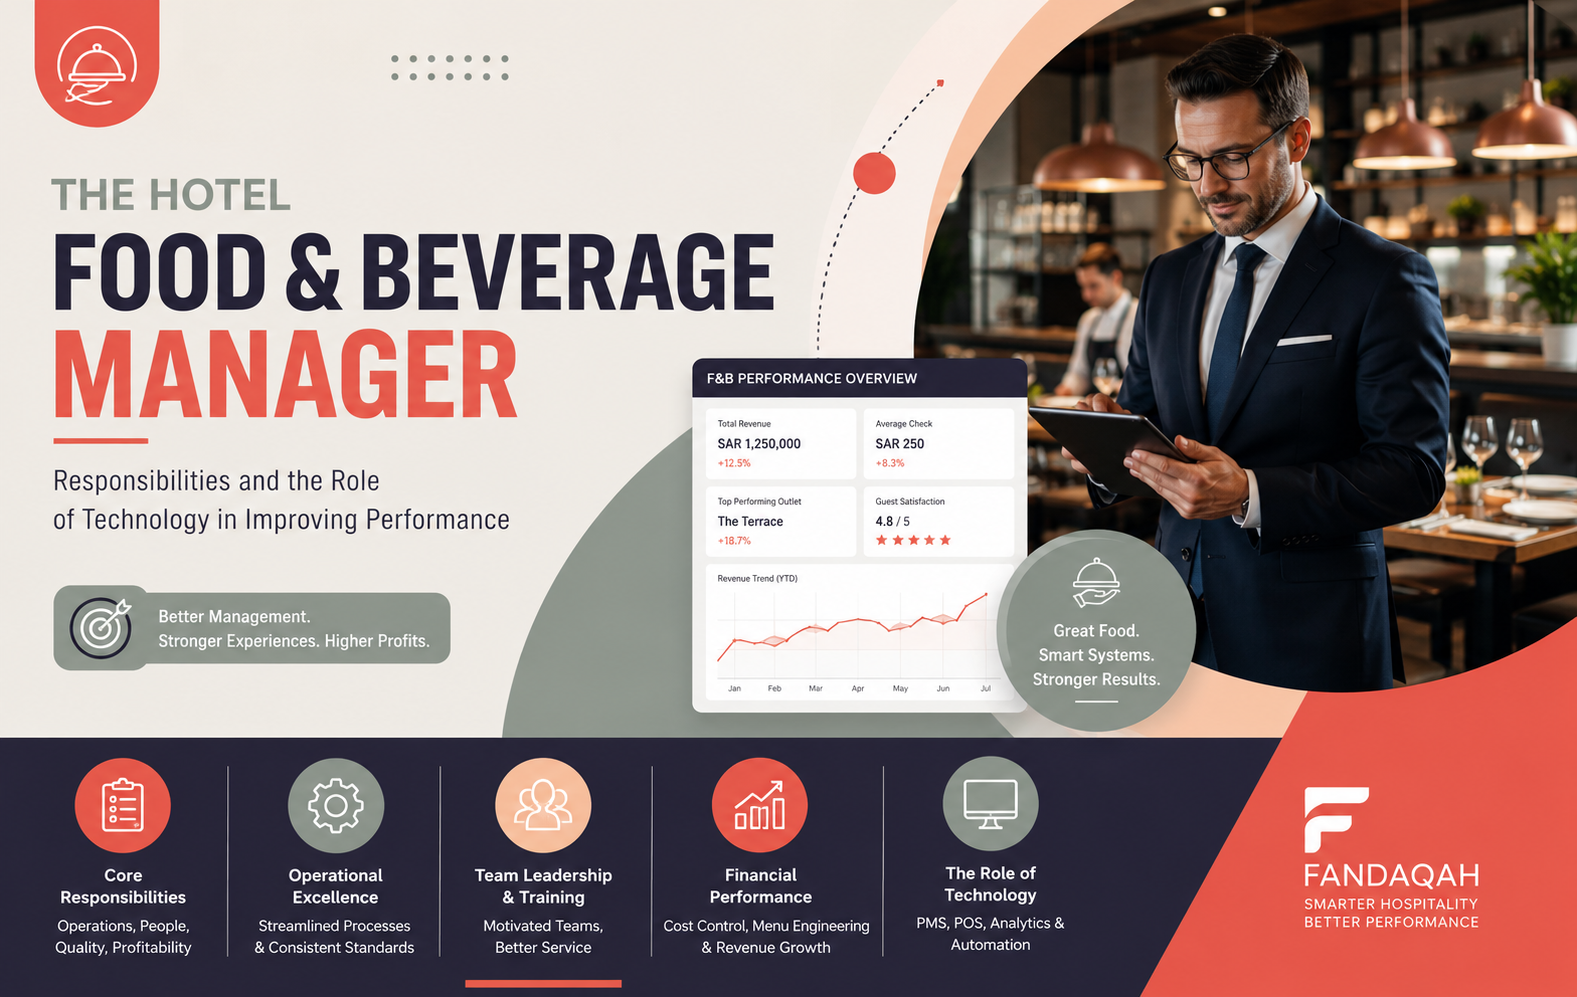
Discover the hotel food and beverage manager’s core responsibilities, technology tools, and how they improve performance in Saudi hospitality....
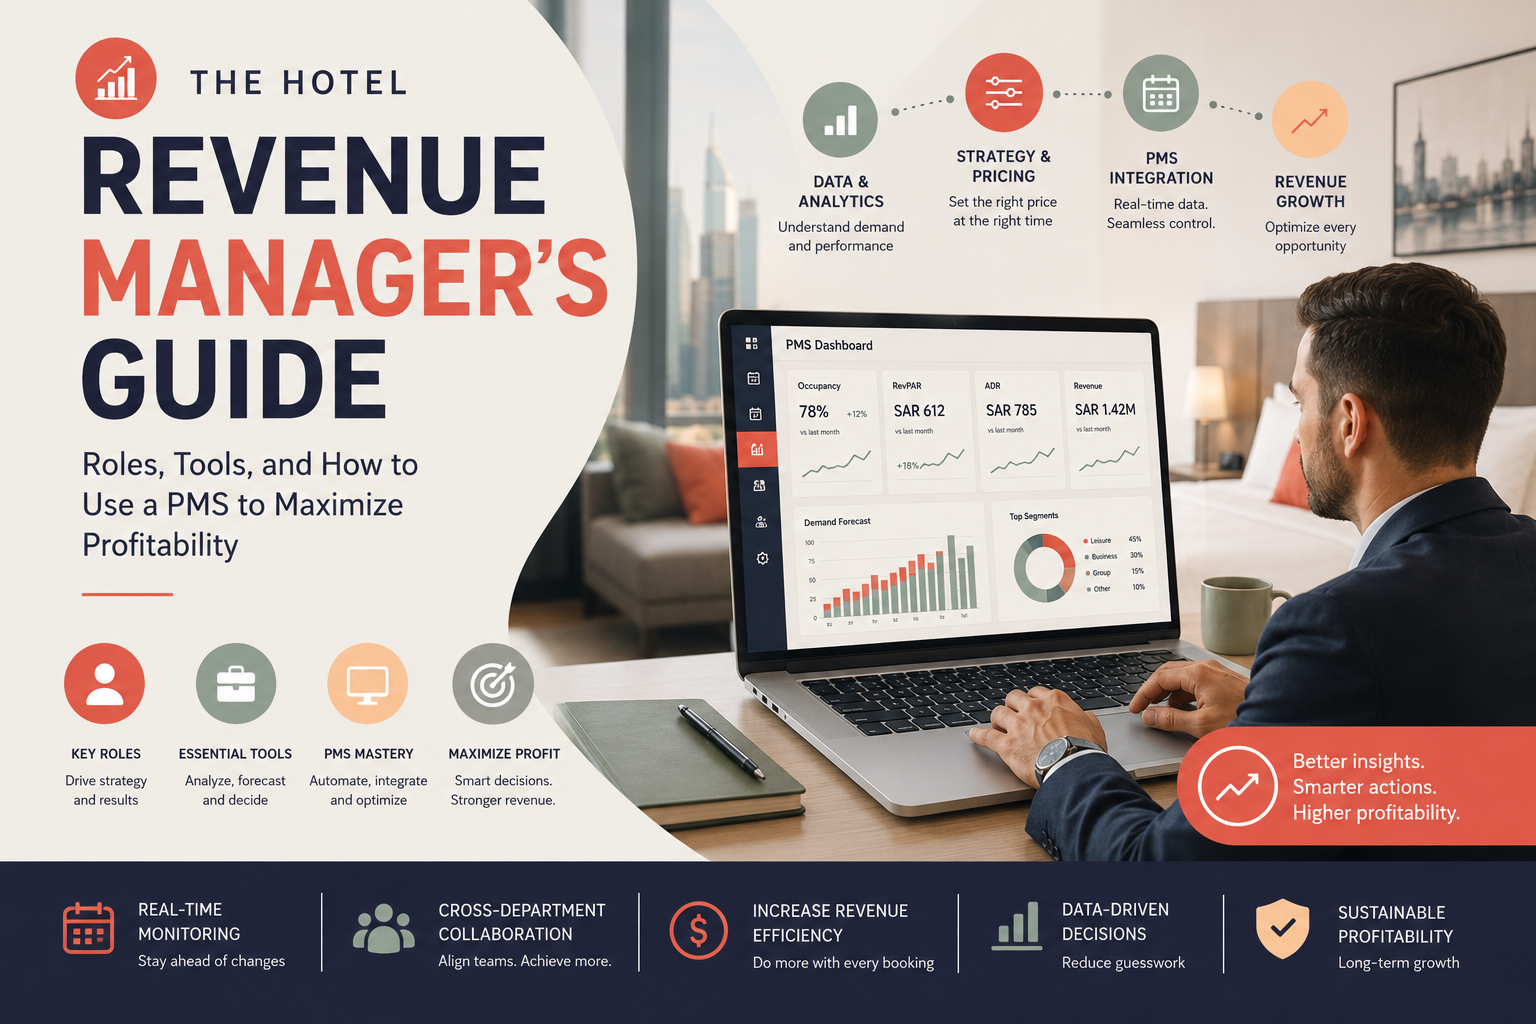
Learn the hotel revenue manager's role, key tools, KPIs, and how a PMS helps maximize hotel profitability with dynamic pricing and revenue management....
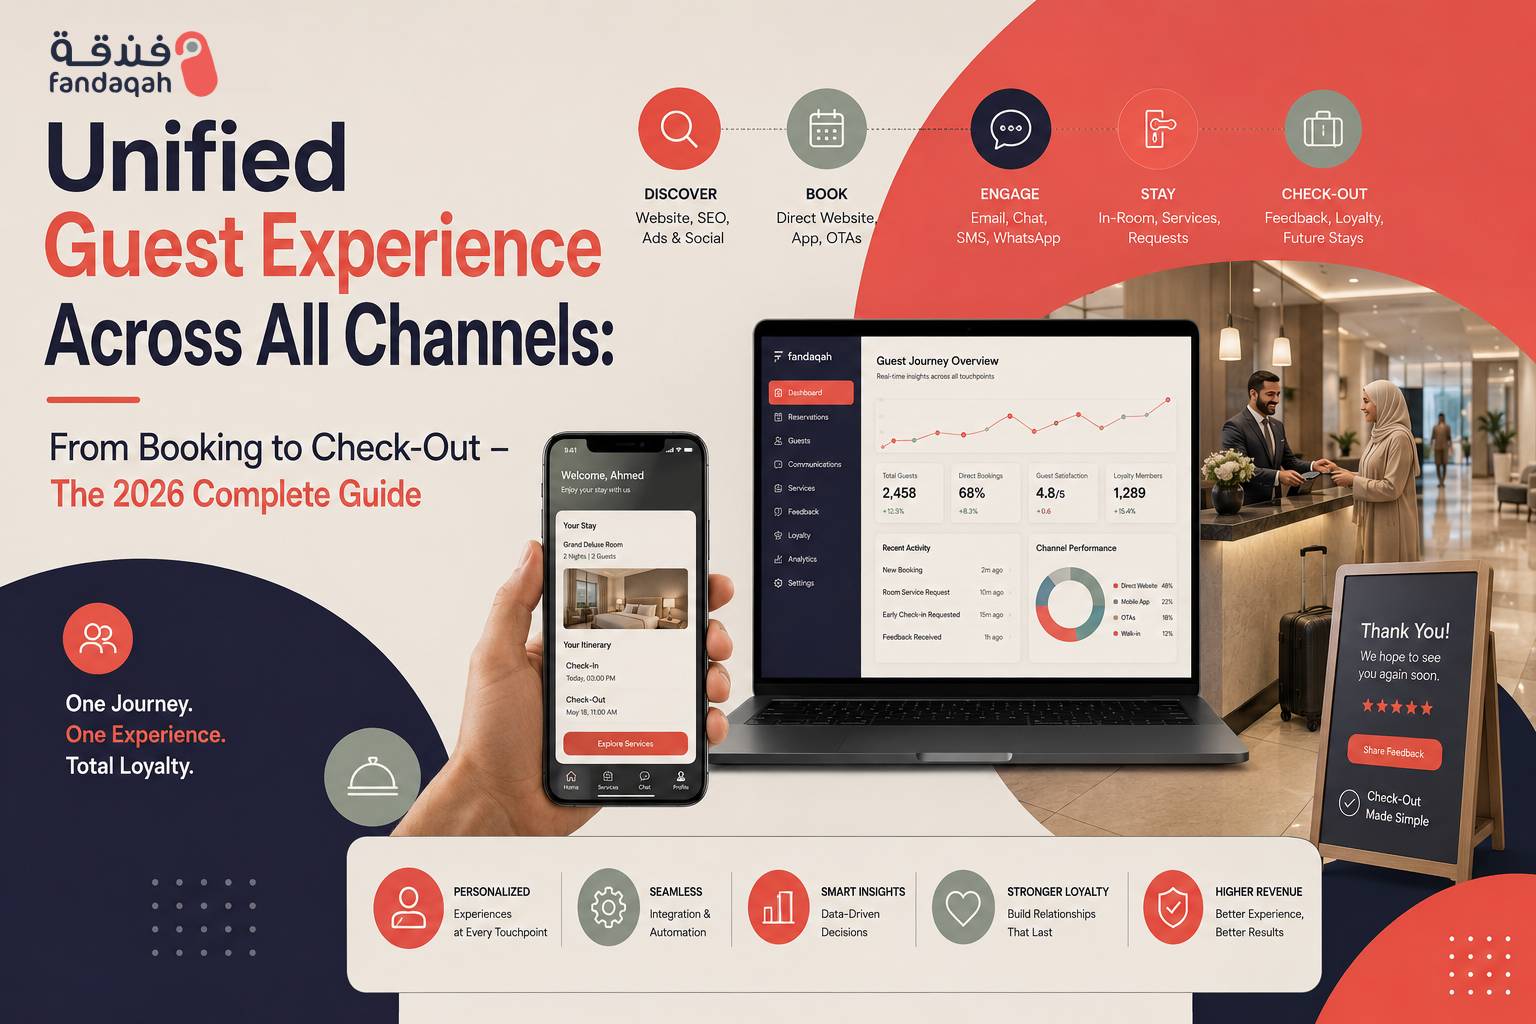
Learn how a unified omnichannel guest experience improves hotel operations, guest satisfaction, loyalty, and direct bookings with modern hospitality technology....

Learn how Saudi hotels can attract bleisure travelers through smart hospitality strategies, better guest experiences, and Vision 2030 tourism opportunities....
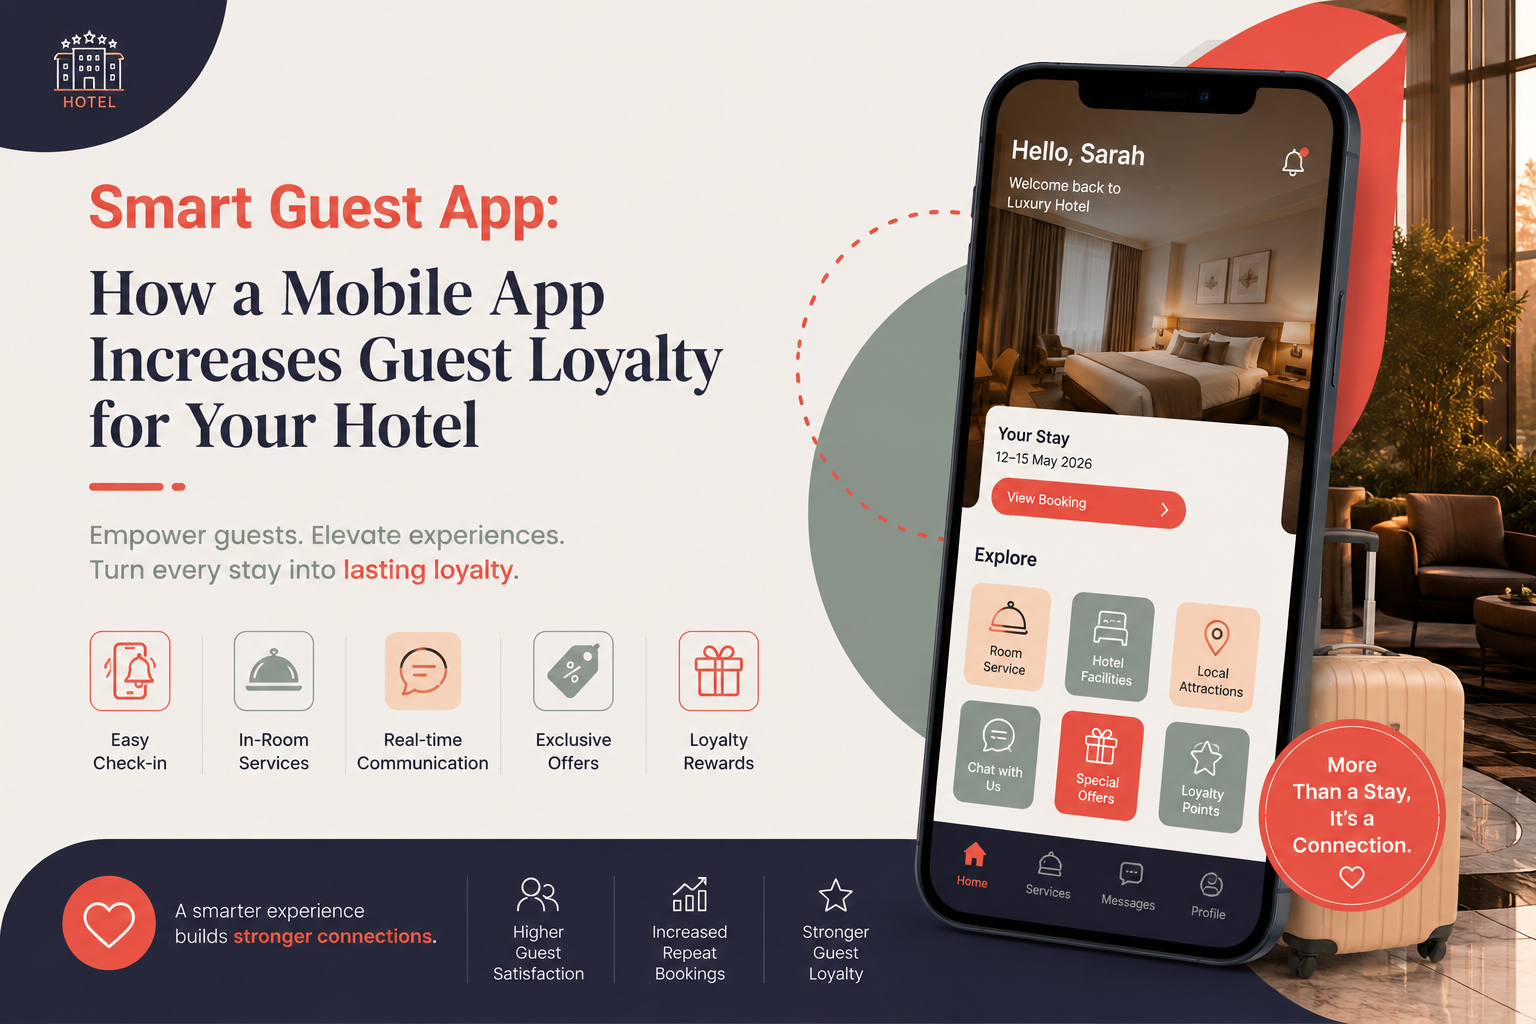
Discover how a smart guest app improves hotel guest loyalty, increases direct bookings, enhances the guest experience, and supports digital hospitality in Saudi Arabia....

Learn how hotel wholesalers work, their benefits and risks, and how Saudi hotels can improve occupancy, revenue, and global distribution....
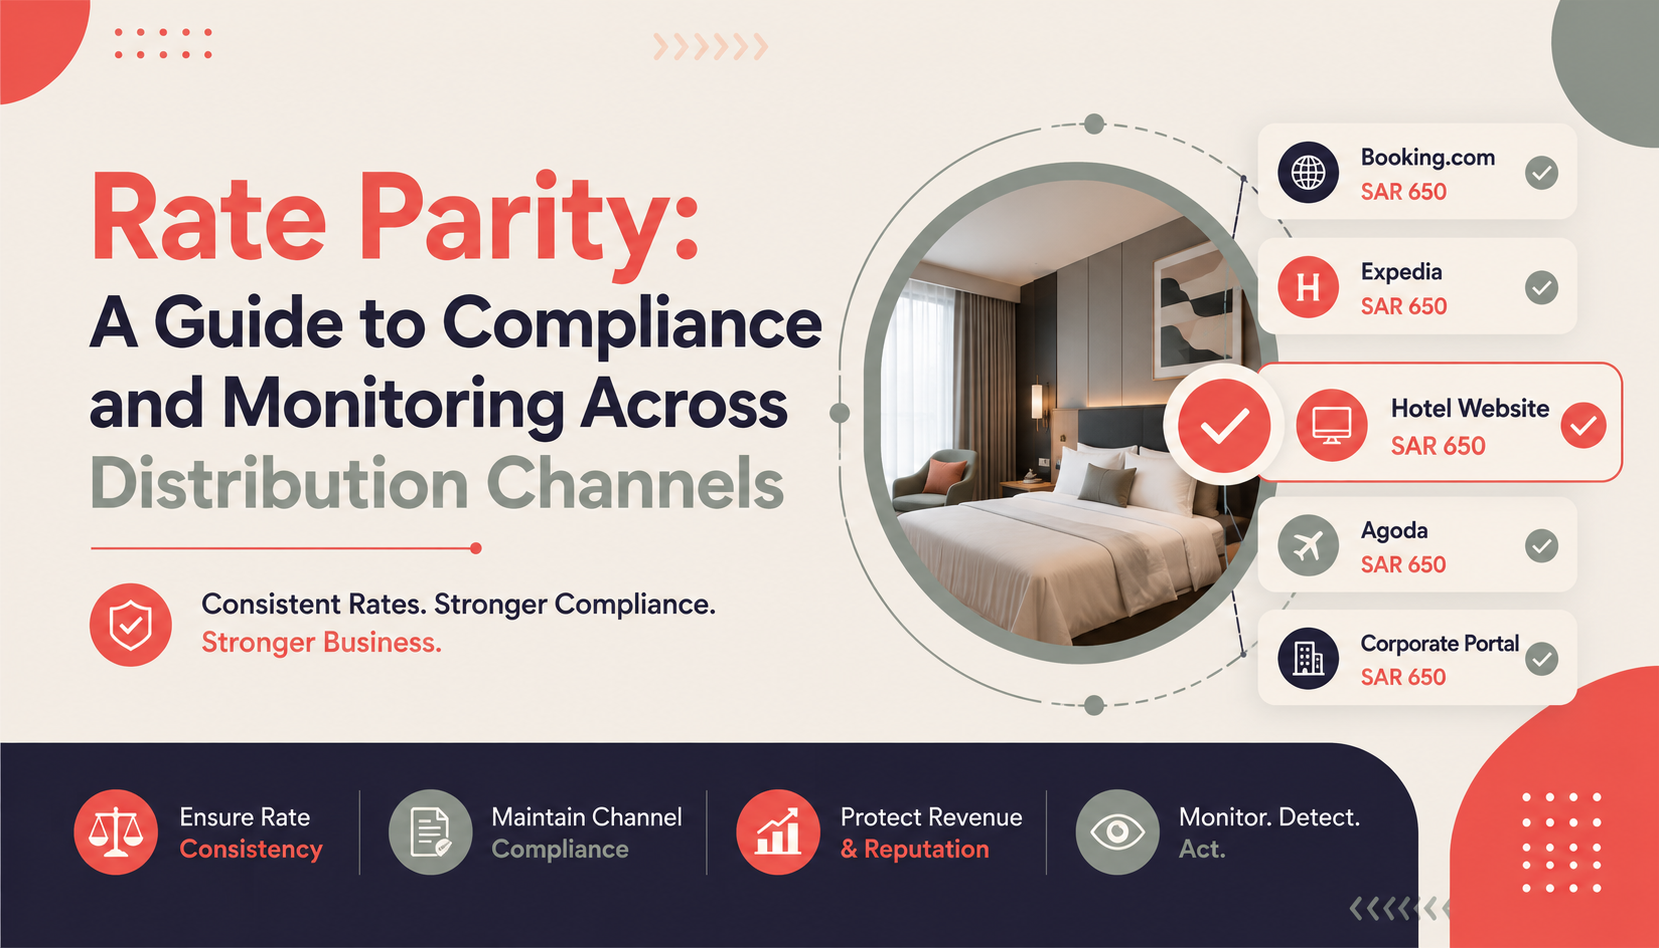
Learn how hotels in Saudi Arabia can maintain rate parity, monitor pricing across OTAs, protect revenue, and improve distribution strategy....

Learn how Saudi hotels can improve Google Hotel Ads visibility, price accuracy, direct bookings, and profitability without increasing ad costs....
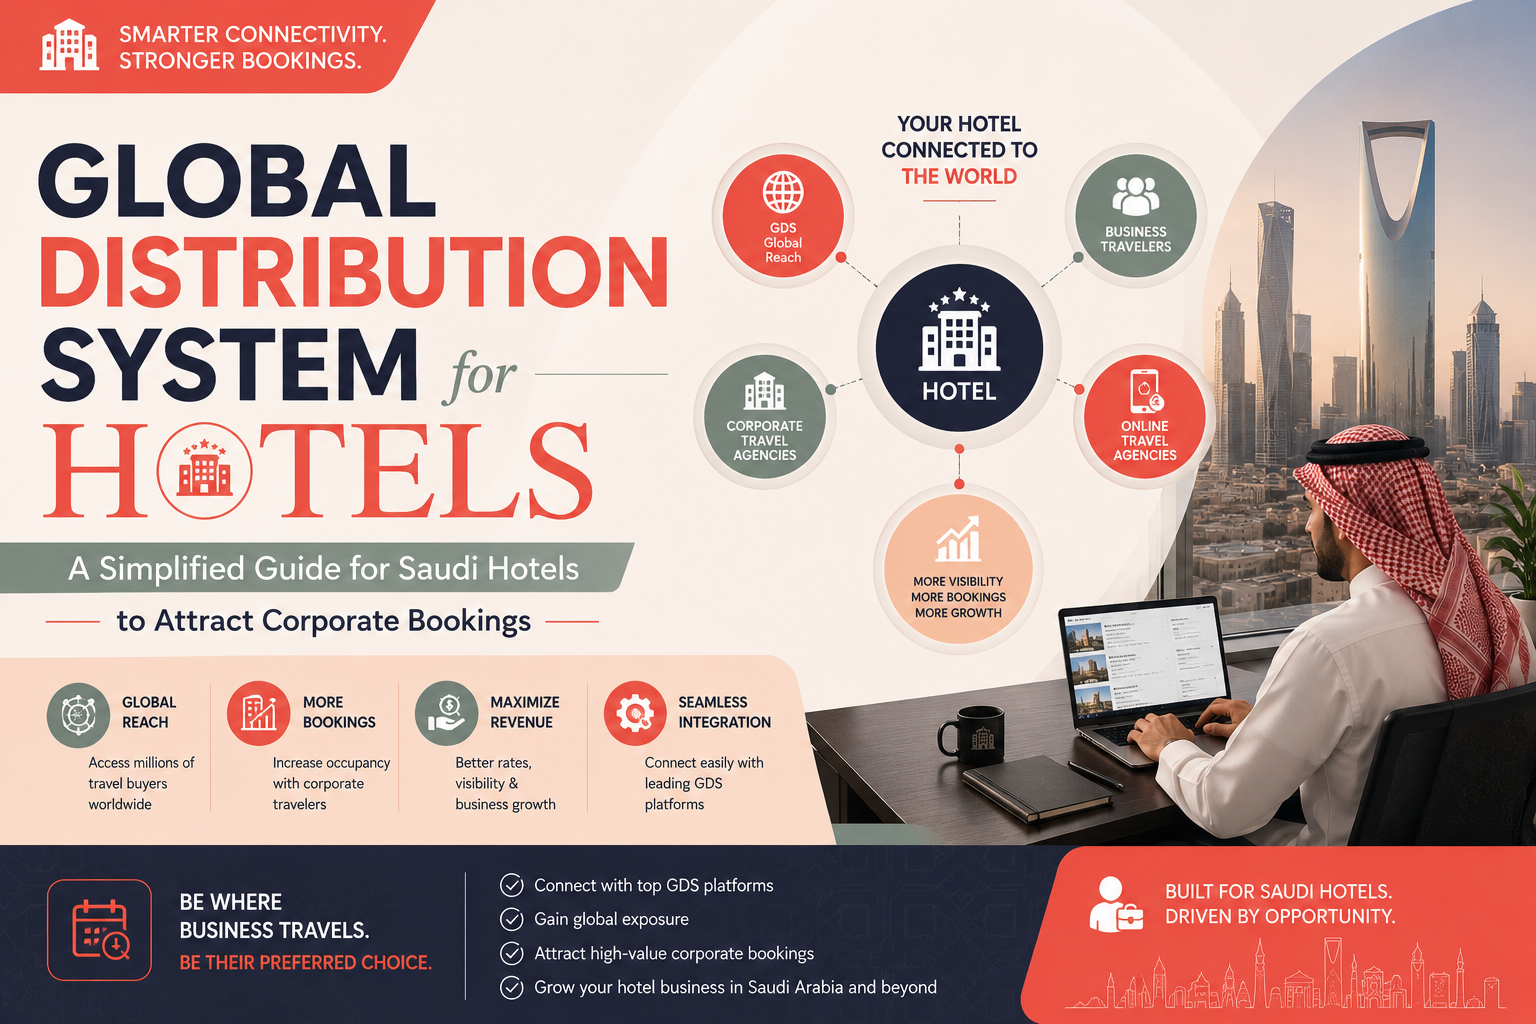
Discover how Saudi hotels in Riyadh, Jeddah, Dammam, and beyond can use a Global Distribution System (GDS) to attract corporate bookings, increase weekday occupancy, and balance distribution channels....
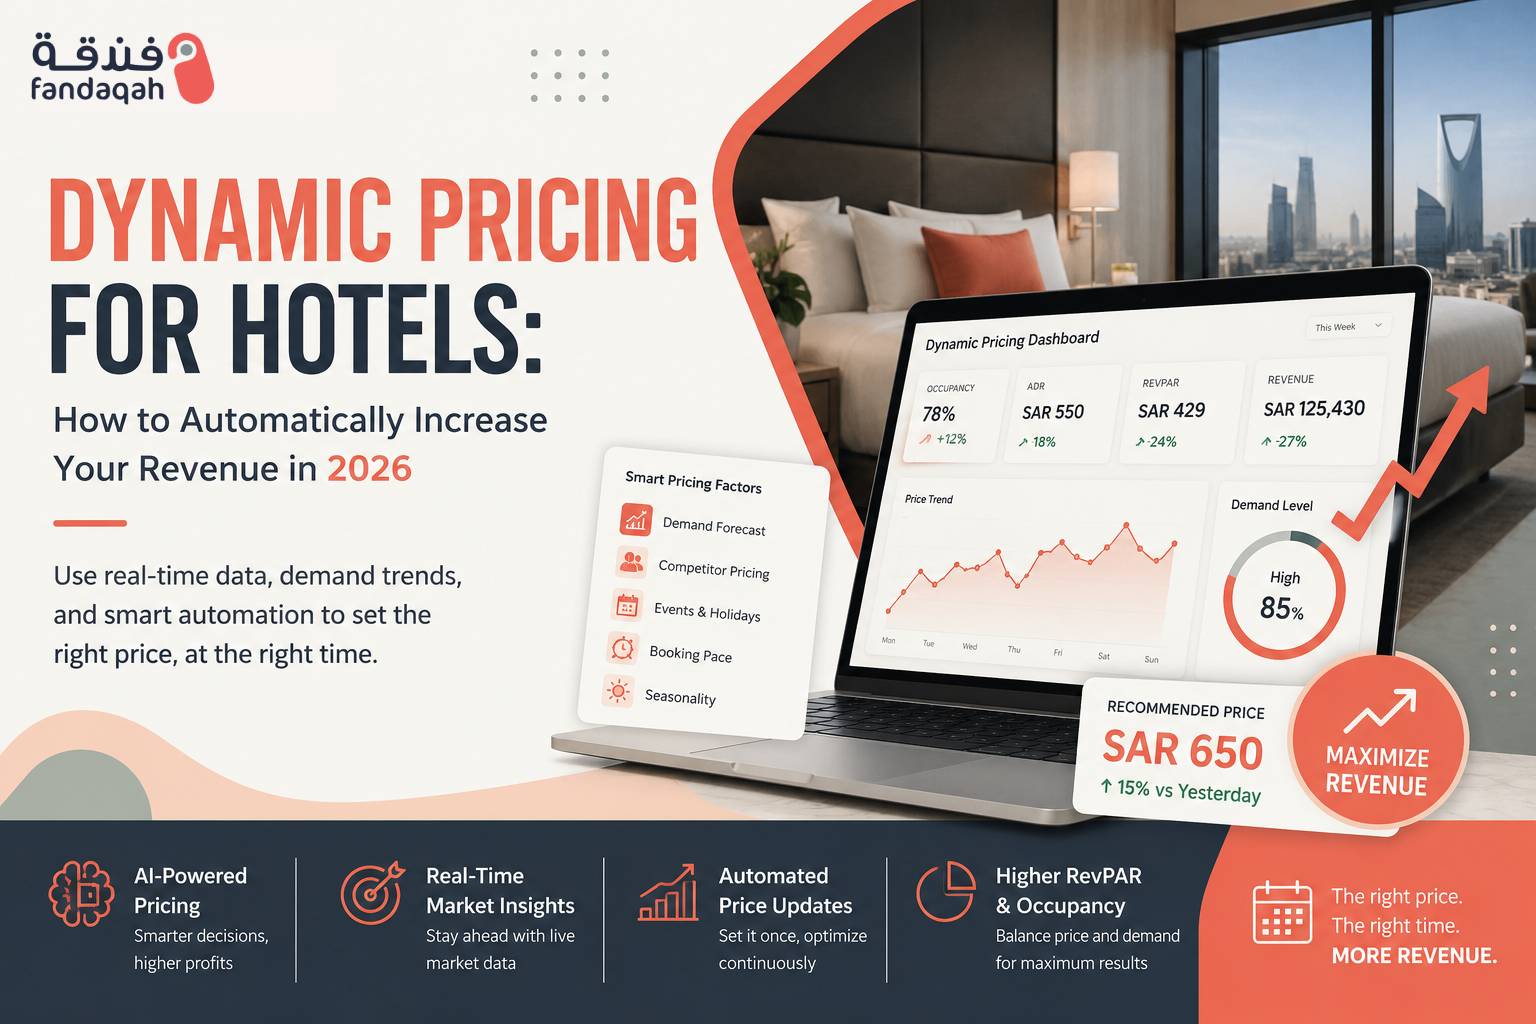
Learn how dynamic pricing uses AI to automatically adjust hotel room rates in real-time. Maximize RevPAR during Hajj, Riyadh Season & Vision 2030 projects with proven strategies for Saudi hotels....
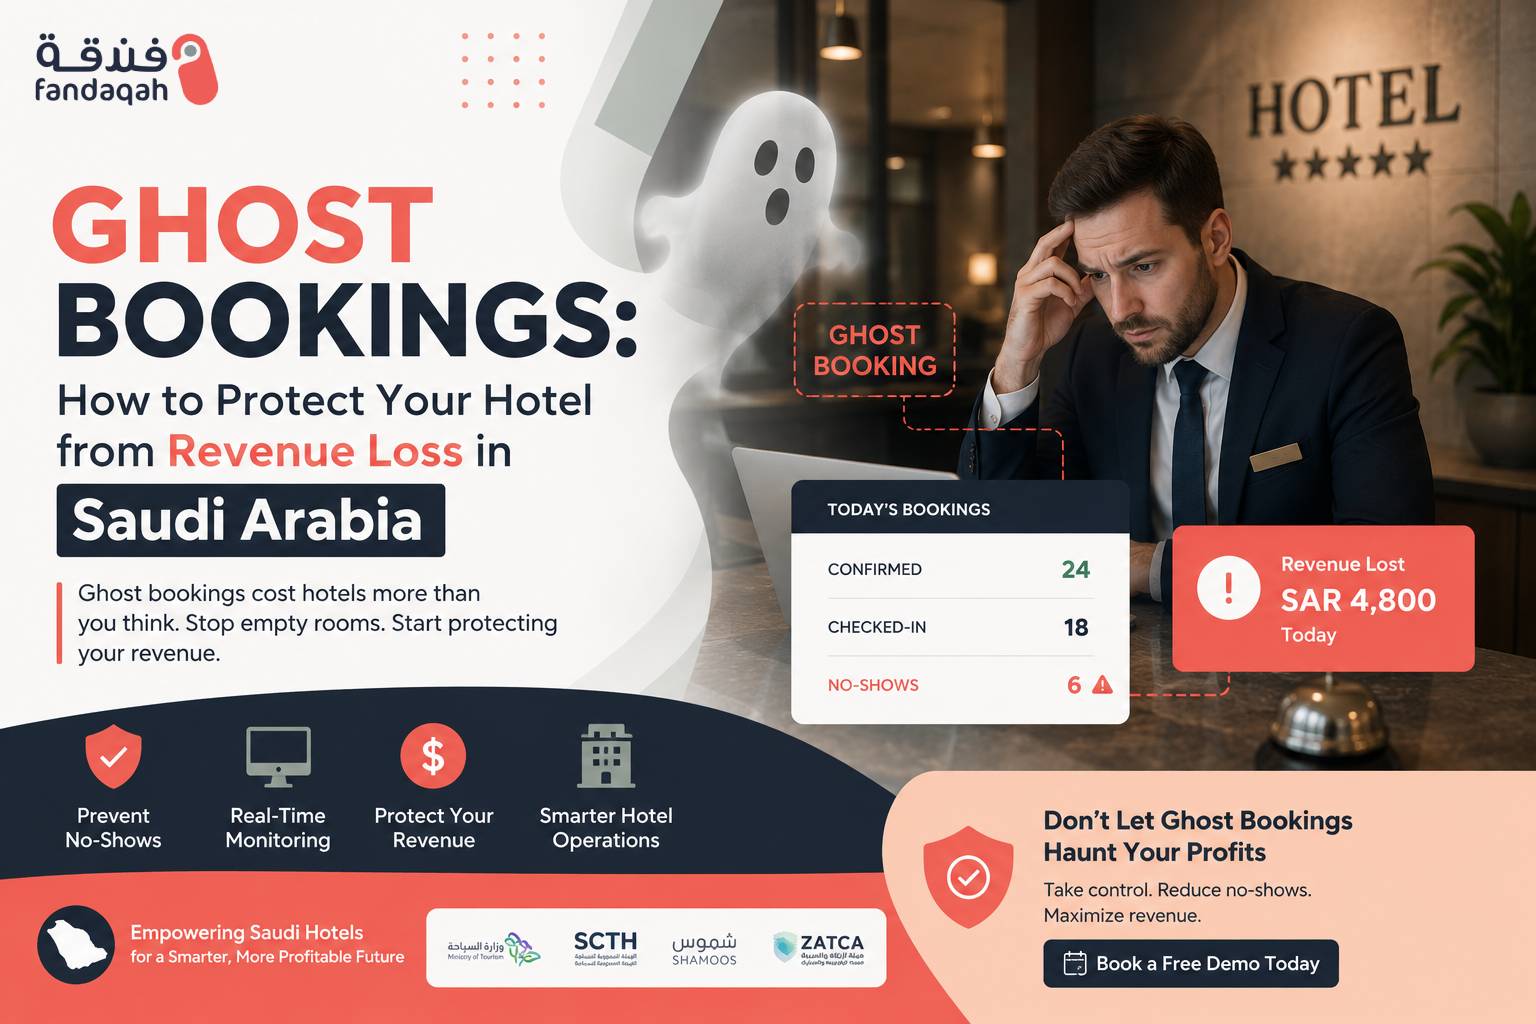
Discover what ghost bookings are, how they silently drain hotel revenue in Saudi Arabia, and practical strategies to prevent them — especially during Hajj, Umrah, and Riyadh Season — in line with ...
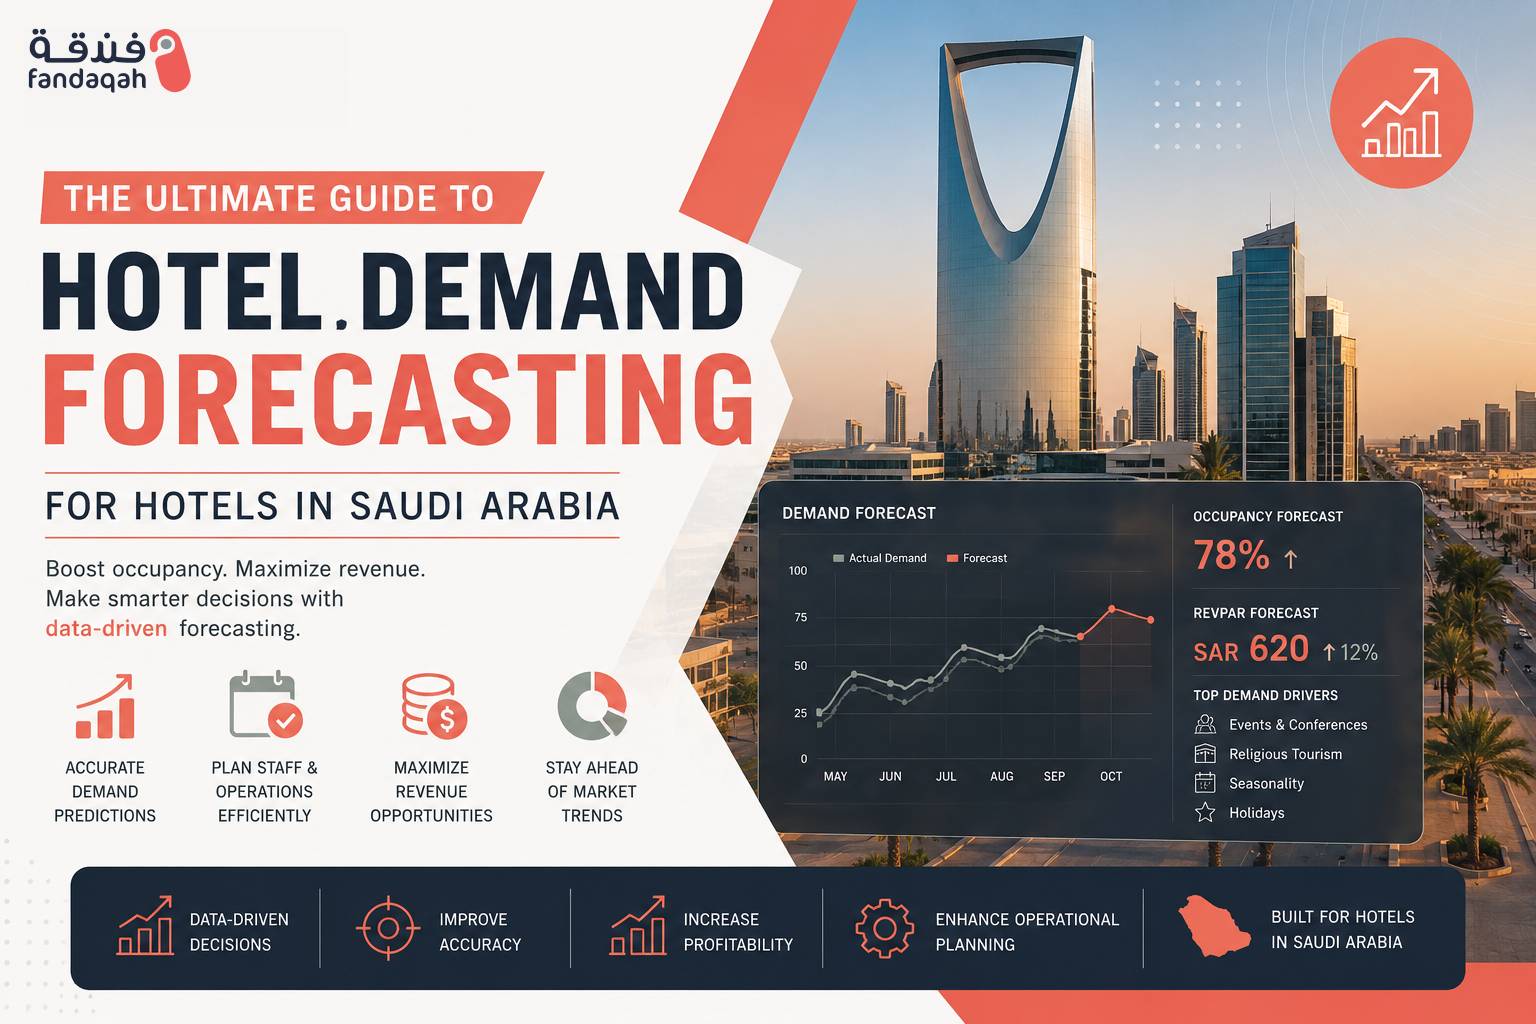
Discover the ultimate guide to hotel demand forecasting in Saudi Arabia. Learn smart strategies for dynamic pricing, revenue management, and maximizing occupancy during Hajj, Vision 2030 events, and p...
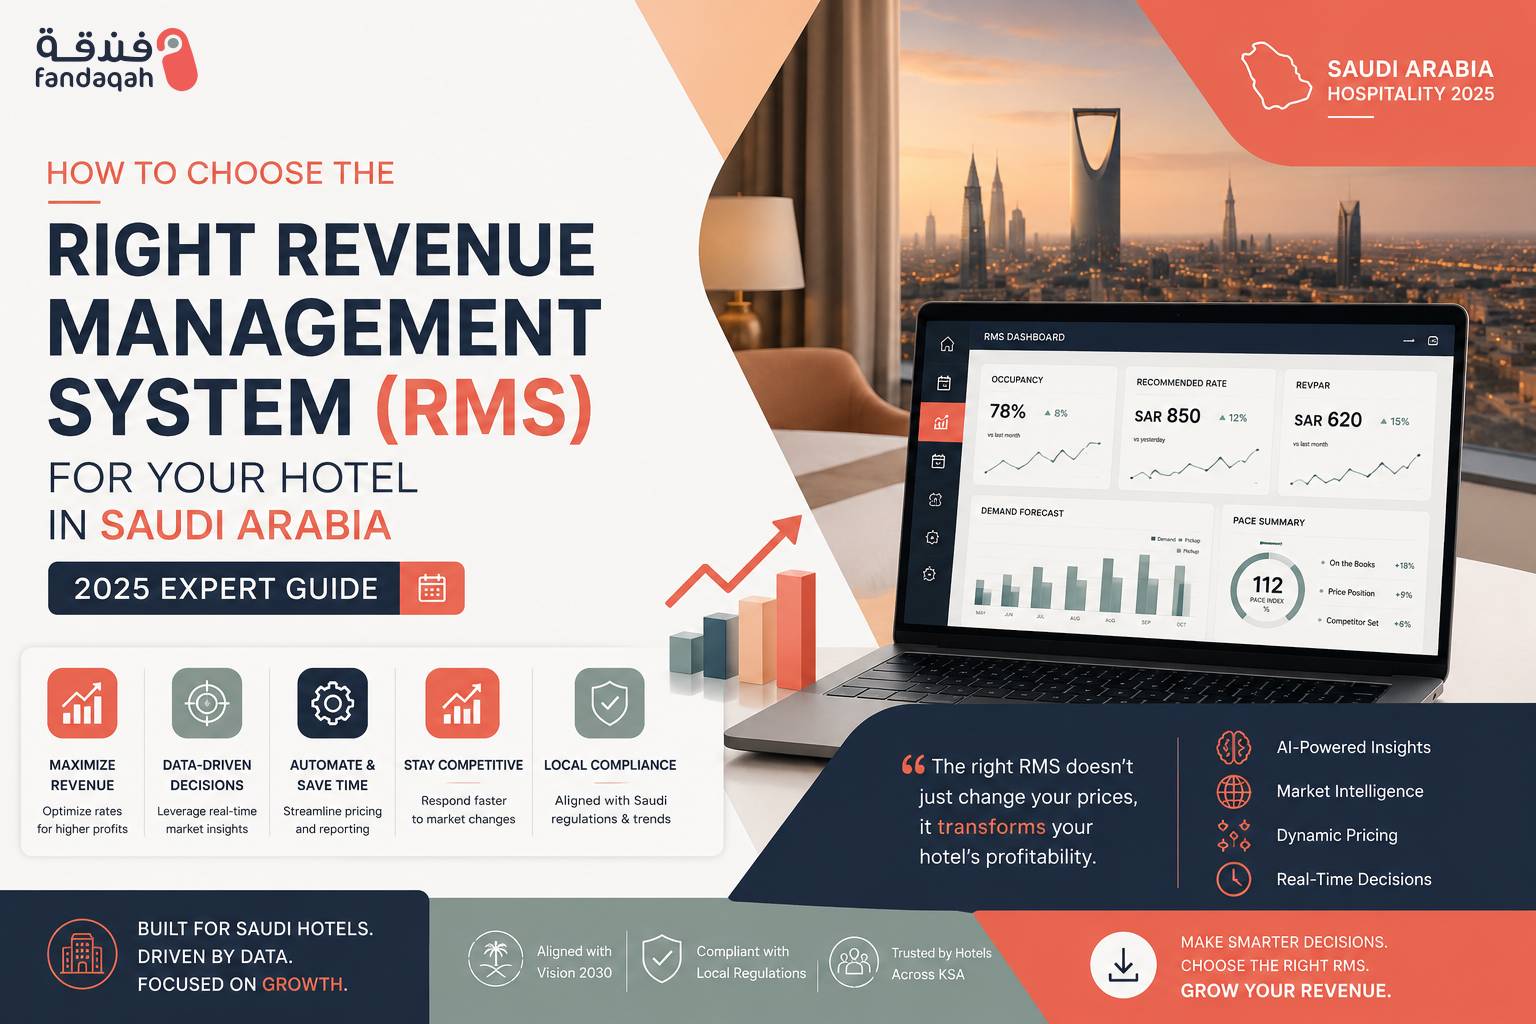
Discover how to choose the best Revenue Management System (RMS) for your Saudi hotel. Expert tips on dynamic pricing, forecasting, integrations, and maximizing RevPAR in line with Vision 2030....

Discover how Arab tourists, especially Saudis, are using AI tools like ChatGPT and Gemini to book hotels. Essential strategies for Saudi hoteliers to optimize for AI discovery and thrive under Vision ...
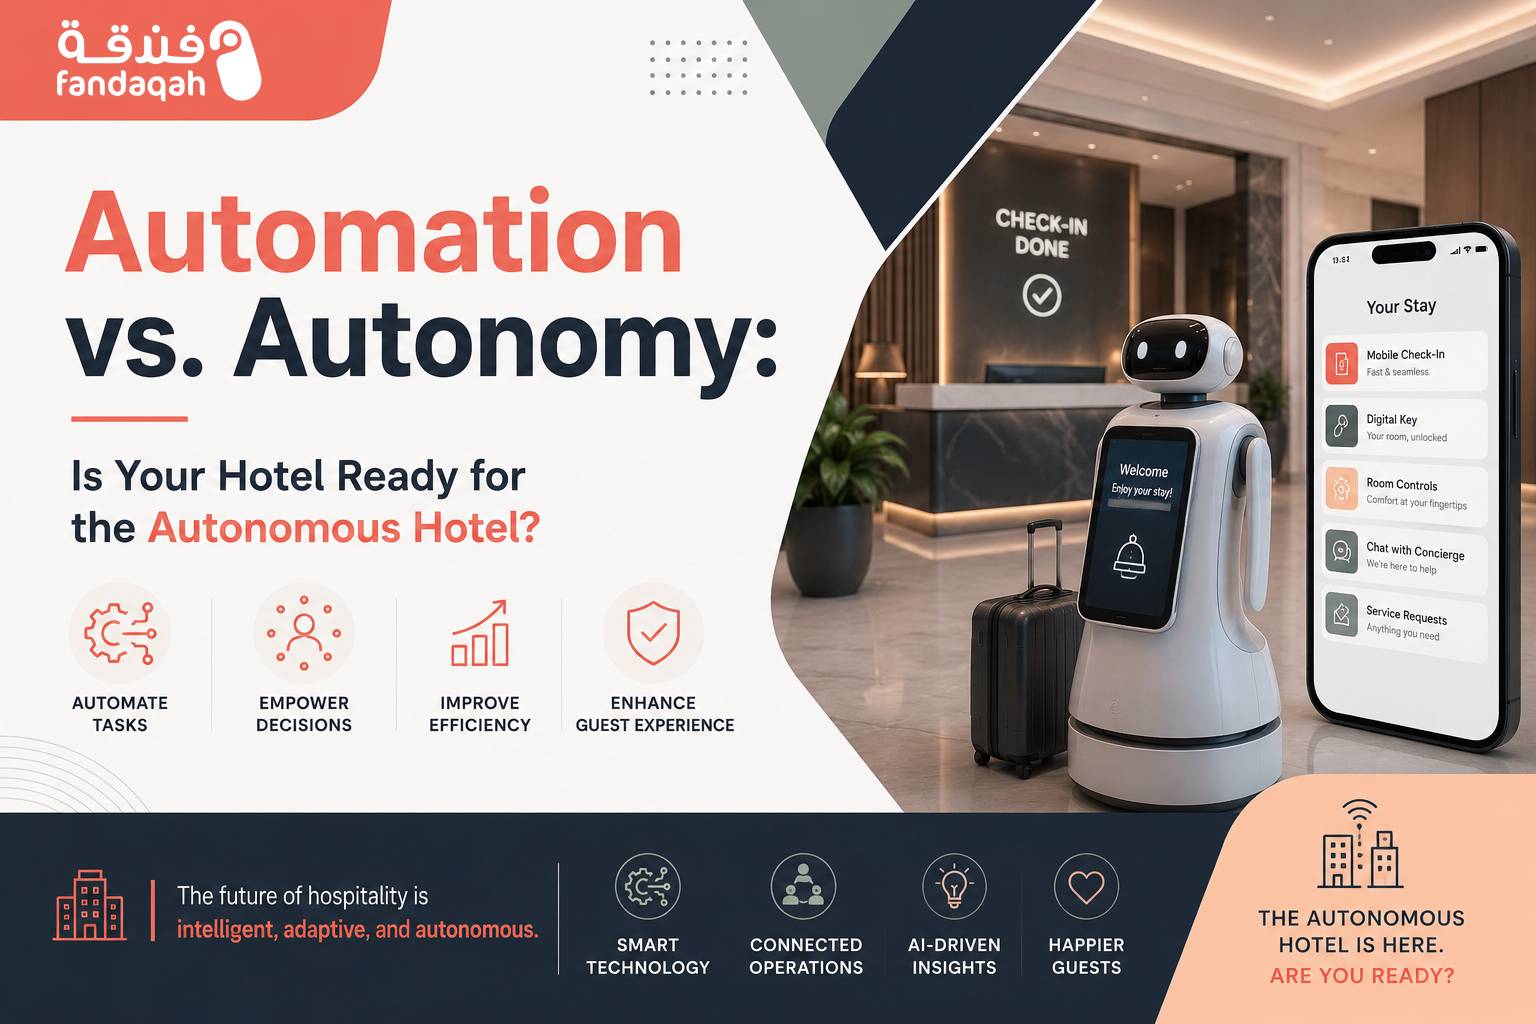
Discover the key difference between hotel automation and true autonomy. Learn how Saudi hotels can embrace AI-driven autonomous operations aligned with Vision 2030 for superior guest experiences and e...
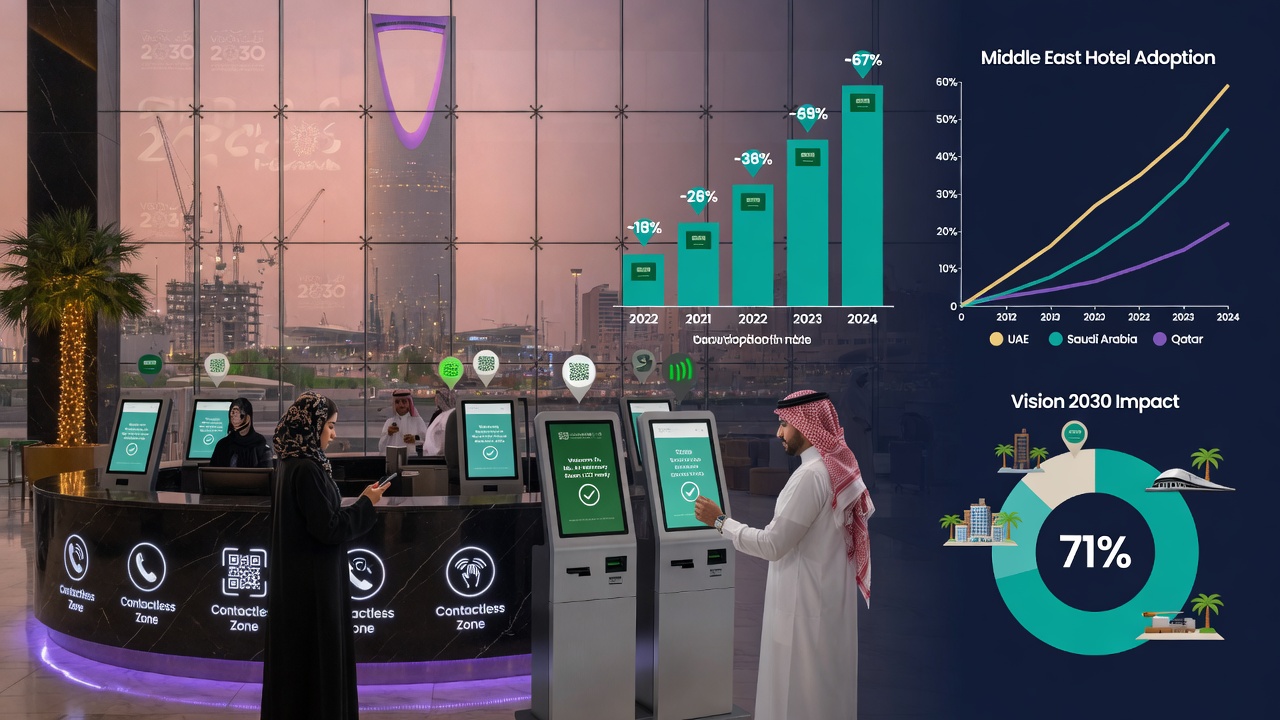
Fast-rising contactless check-in in Middle East hotels 2026. Saudi adoption at 68% thanks to Vision 2030. Benefits, cases & tips for hotel owners....

Discover the best free and affordable hotel PMS tools for 2026 in Saudi Arabia. Features ZATCA e-invoicing, channel manager, and Arabic support for budget hotels....

Complete guide to hotel distribution channels in the Arab world. Optimize OTAs, direct bookings, GDS & metasearch for Saudi hotels to grow revenue with Vision 2030 strategies....

Explore how modern unified payment platforms are simplifying cross-border hotel payments in the GCC. Saudi hotels can now achieve same-day settlements, multi-currency support, reduced fees, automated ...
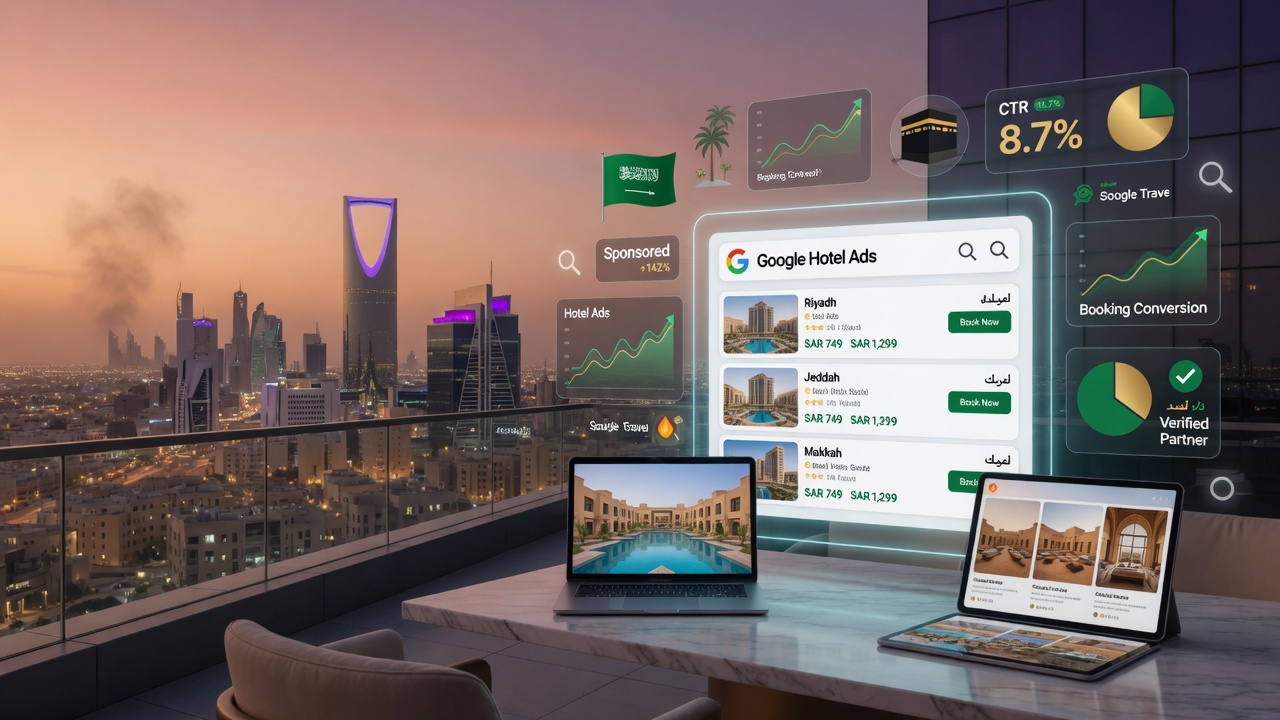
Master Google Hotel Ads for Saudi hotels in 2026. Optimize your metasearch strategy to drive direct bookings, reduce OTA commissions, and leverage Vision 2030 tourism growth....
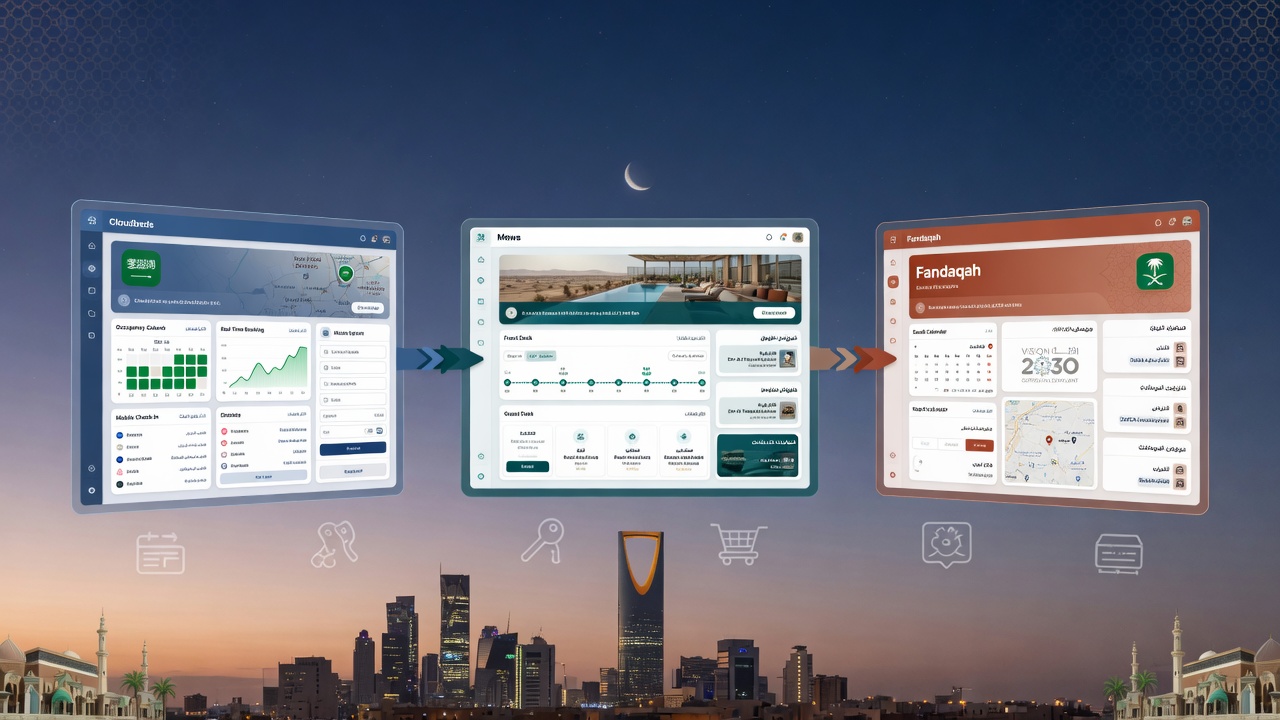
Compare Cloudbeds, Mews and Fandaqah PMS platforms for Saudi hotels in 2026. See which system wins on Arabic support, local payments (Mada/STC Pay), Hajj/Umrah peak handling, Vision 2030 readiness and...

Discover how to design a hotel loyalty program with reward points in Saudi Arabia. Boost guest retention, align with Vision 2030, and keep guests returning....
Discover the 12 essential questions Saudi hotels must ask before choosing a Hotel Management System (PMS), including ZATCA compliance, cloud PMS, and Hajj & Umrah operations....
Discover the best hotel management software for 2026 in Saudi Arabia. Compare features, pricing, ZATCA e-invoicing, and Vision 2030 readiness. Free consultation....
Discover how a serviced apartments operations program streamlines hospitality management in Saudi Arabia. Features, benefits & Vision 2030 insights inside....

Discover how hotel apartment software in Saudi Arabia automates accounting, boosts occupancy, ensures ZATCA compliance, and aligns with Vision 2030....
Discover how a hotel operating program (PMS) can streamline operations, boost revenue, and delight guests in Saudi Arabia's tourism sector....
Discover how serviced apartment management software streamlines Saudi hospitality, ensures Taskeen compliance, and boosts revenue. Complete guide....
Discover the best hotel software and PMS in Saudi Arabia. Our ultimate guide covers features, ZATCA compliance, Vision 2030 trends, and top picks for hotels of all sizes....
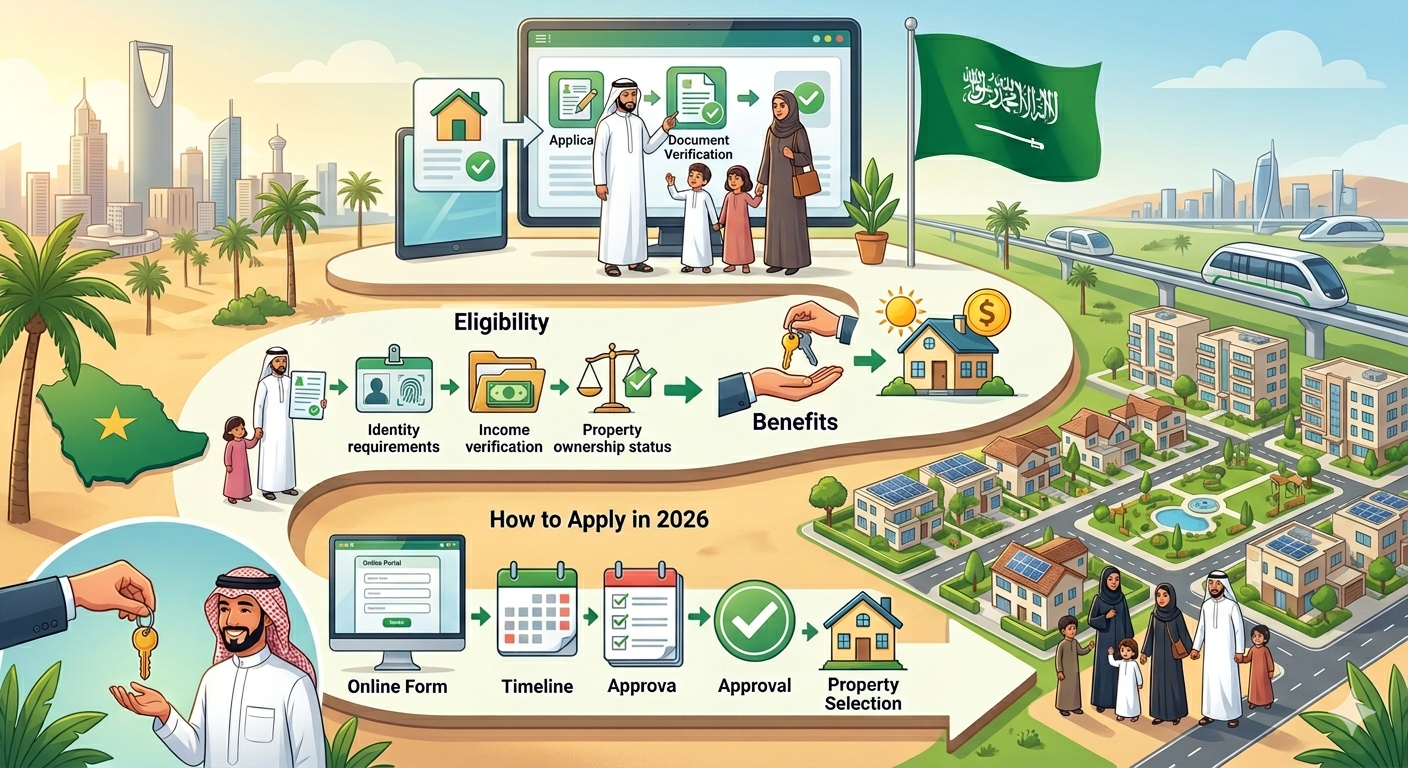
Discover Saudi Arabia’s Housing Allocation Program for government employees: eligibility, Sakani application process, and Vision 2030 homeownership goals in 2026....
Explore the best placement program for strategic talent deployment in KSA. Achieve Vision 2030 goals, enhance Saudization, streamline HR placement. Your guide....
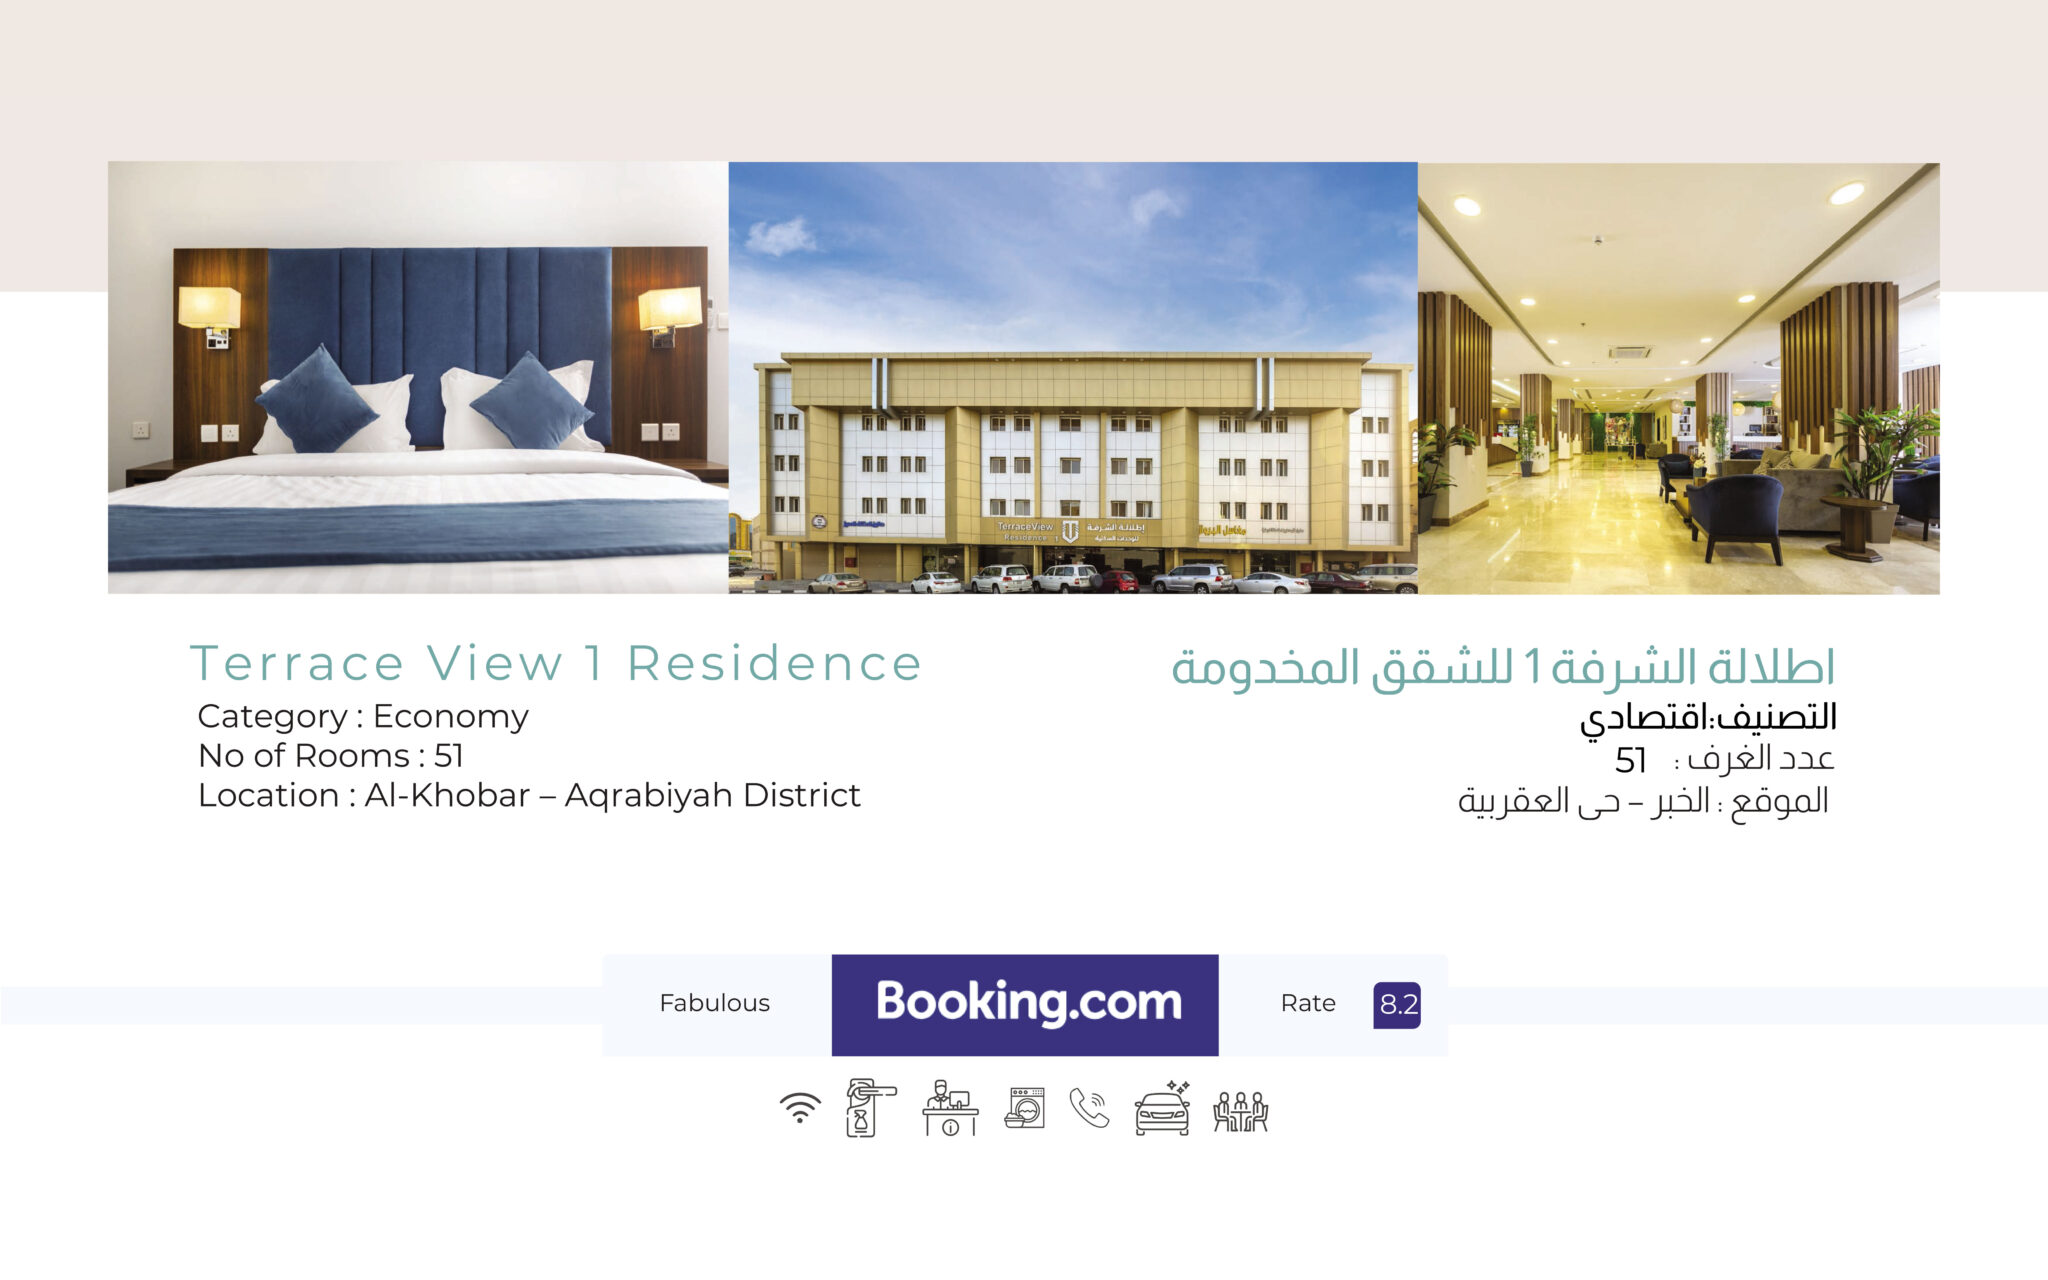
Terrace View 1 Residence, a cozy economy-class serviced apartment in Al-Khobar, faced operational hurdles that many growing hotels and apartments encounter: ...

Eco-Friendly Hotel in Saudi Arabia: Sustainability Guide for Vision 2030. Learn energy, water and waste savings to lower costs and attract eco guests with Fandaqah....

Learn how Saudi hotels can attract MICE tourism with event-ready facilities, smart marketing, group booking tools, and ZATCA-compliant operations....
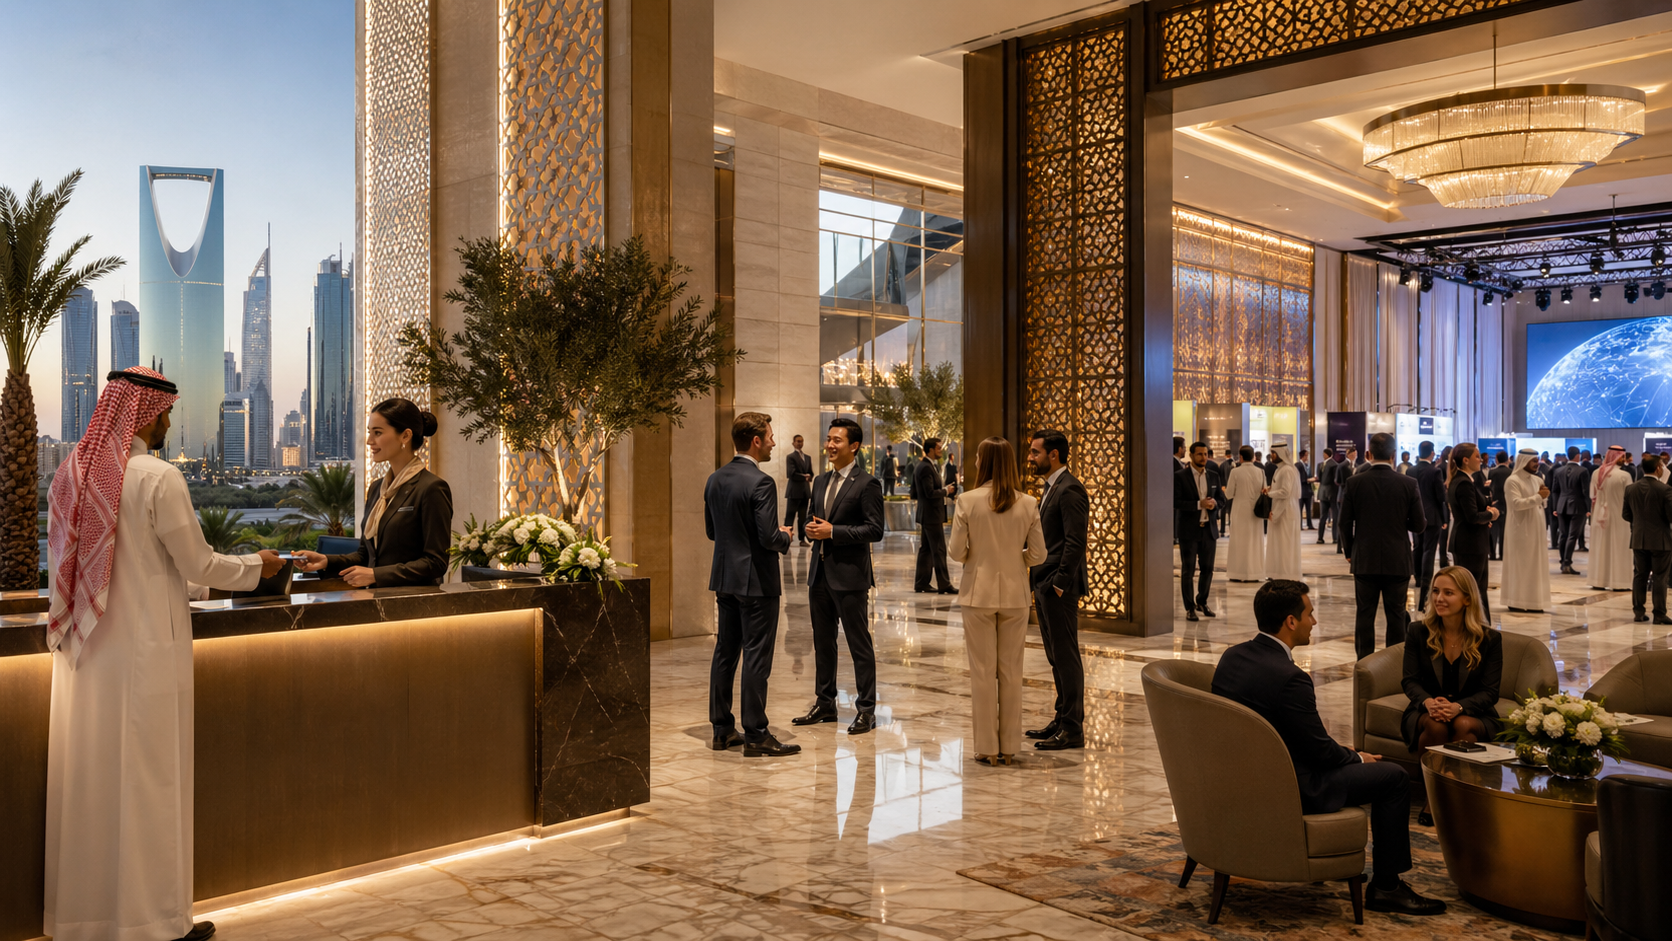
Discover key principles of scalable hotel digital transformation for Saudi hotels, including cloud PMS, automation, ZATCA compliance, and guest experience....
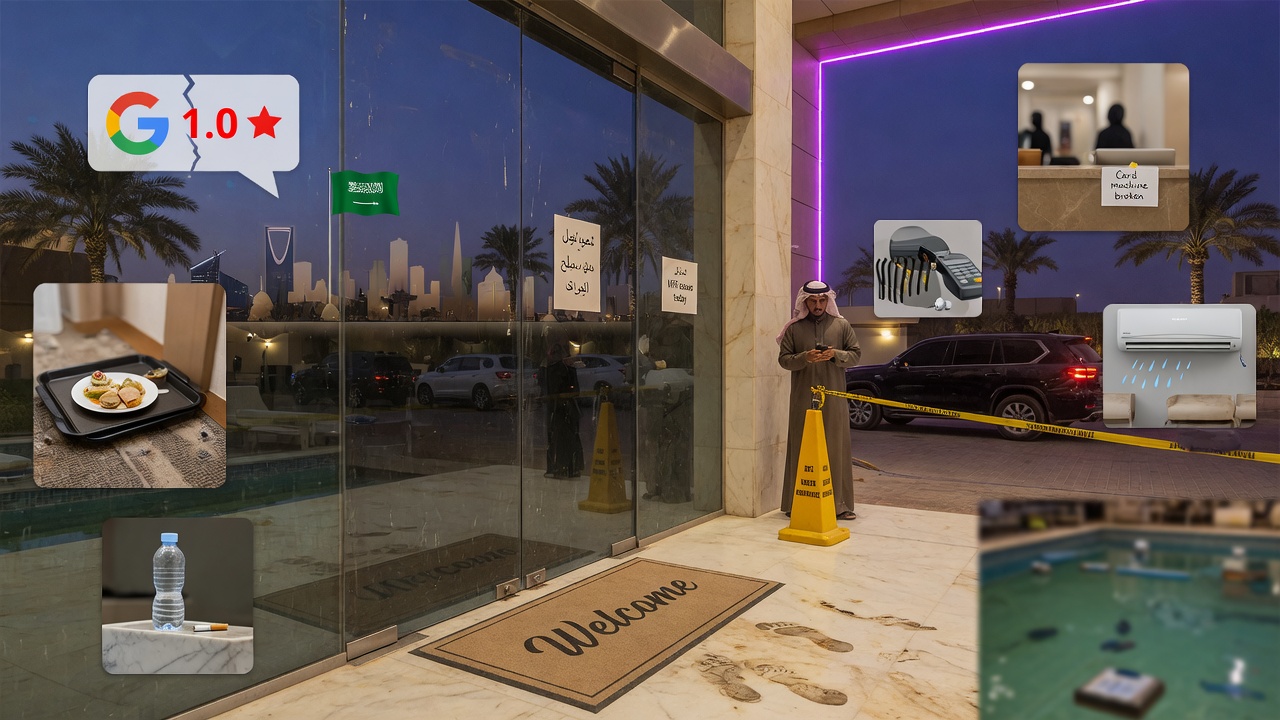
7 friction points killing hotel Google ratings in Riyadh & Jeddah. Fix check-in, cleanliness, communication, noise, fees & tech to boost ratings & bookings....

Discover how guest personalization turns Saudi hotel visitors into loyal advocates. Learn strategies for tailored experiences and loyalty programs....

Complete guide to Personal Data Protection Law compliance for Saudi hospitality. Practical steps to protect guest data, build trust, and meet SDAIA requirements under Vision 2030...
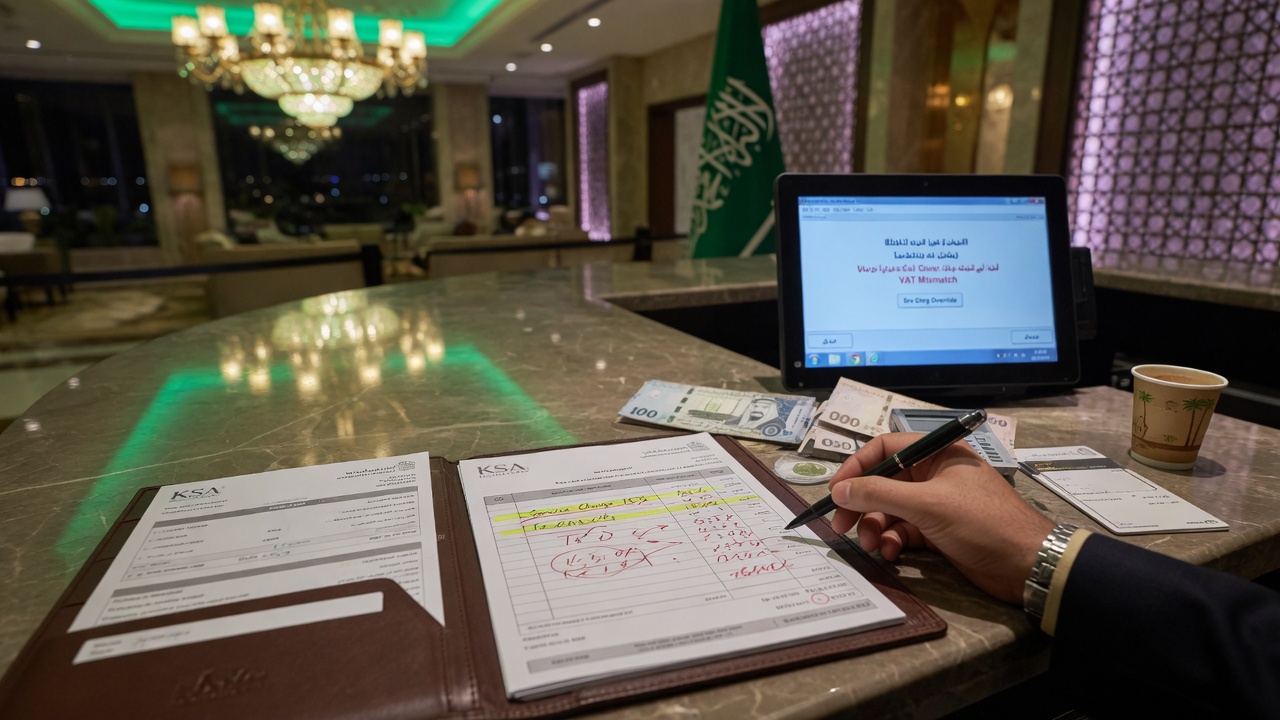
Discover how to stop revenue leakage in Saudi hotels from tax, VAT, and service charge errors. Cloud PMS ensures ZATCA compliance and protects profitability....

Discover how staycation marketing helps Saudi hotels attract local residents and fill empty weeks. Actionable strategies for year-round occupancy....
Learn how Saudi hotels can win corporate RFPs and secure business travel bookings. Strategies for rates, PMS billing, and contract negotiation....

Increase hotel bookings & iftar sales during Ramadan 2026 in Saudi Arabia with targeted marketing strategies, iftar packages, Ramadan tents, and PMS automation....

Learn how WhatsApp Business enhances guest communication and direct bookings for Saudi hotels. Discover strategies, automation & Vision 2030 alignment....
Discover how to choose the best hotel channel manager for Saudi Arabia's hospitality sector in 2026. Boost occupancy, sync rates, and maximize revenue with our complete guide....

Guide to hotel sales manager skills, tools & strategies for corporate and pilgrimage sales in Saudi Arabia. Win with Vision 2030....
Learn to implement self-service & digital check-in in Saudi hotels seamlessly. Align with Vision 2030, cut wait times by 70%, and enhance guest experience....
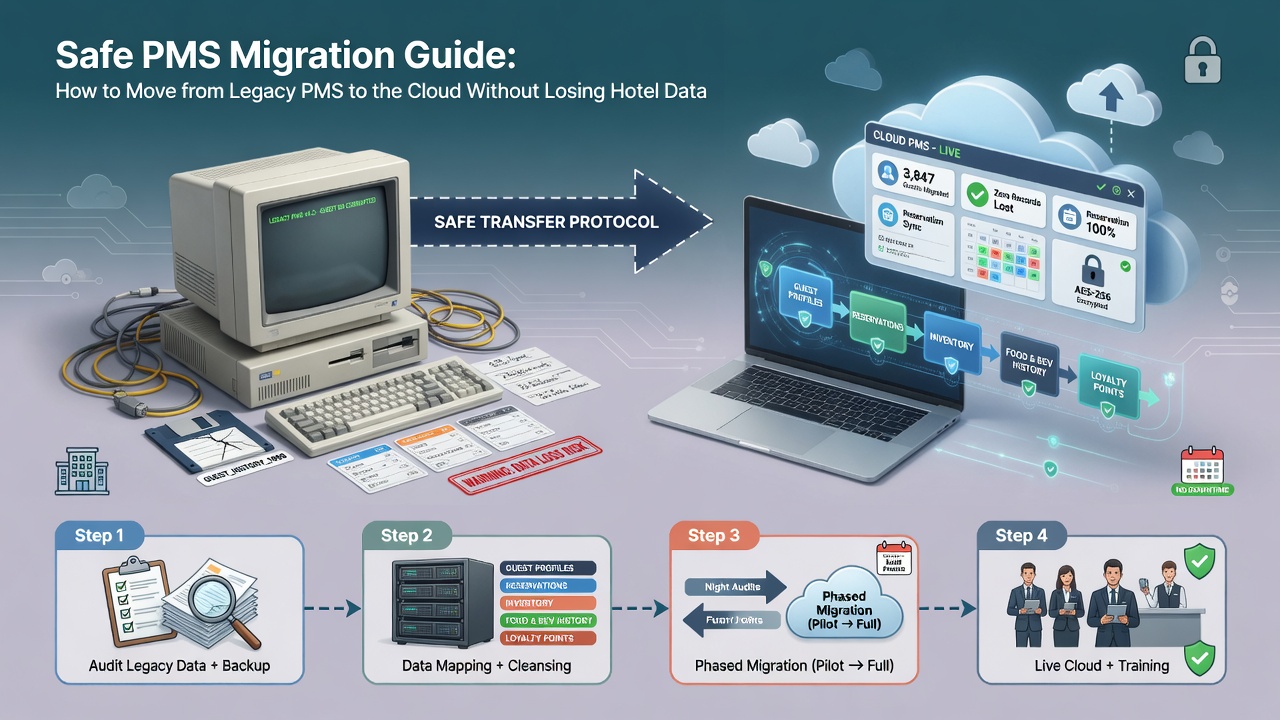
Step-by-step guide for Saudi hotels to safely migrate from legacy PMS to cloud. Protect guest data, reservations & finances. Learn best practices, avoid data loss...
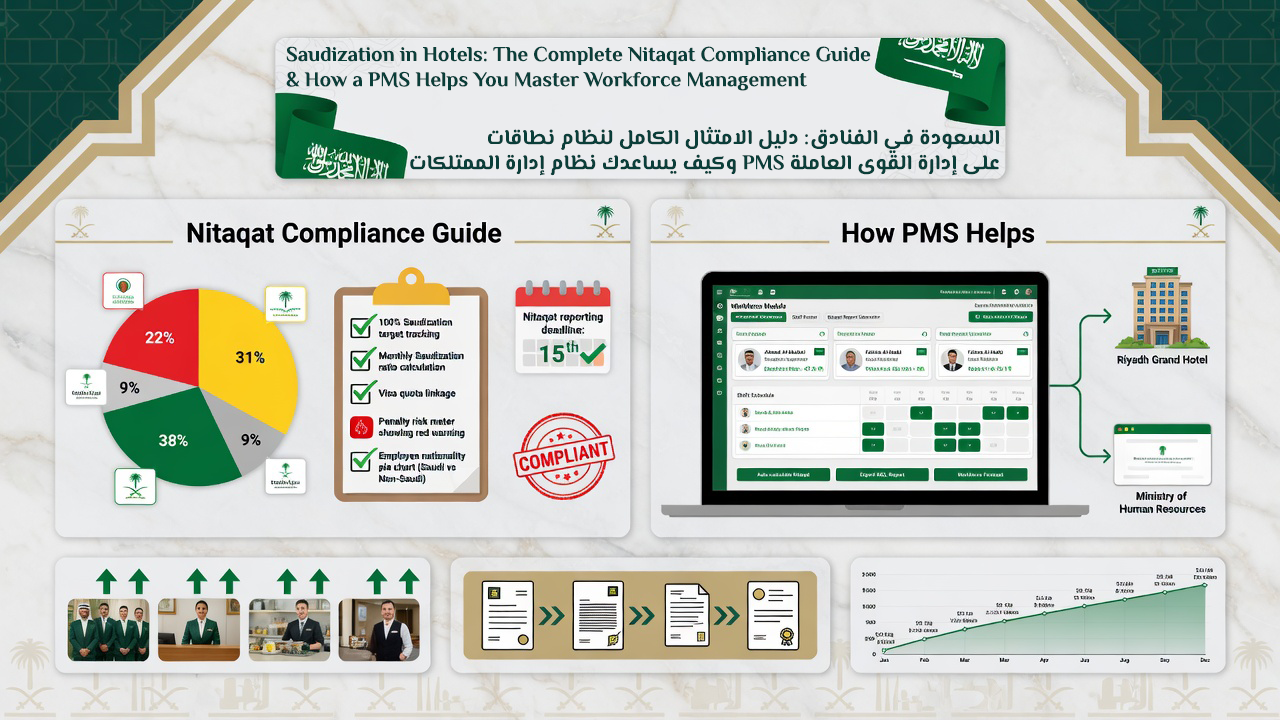
Complete guide to Saudization in hotels & Nitaqat compliance in KSA. Learn how a PMS helps manage workforce, achieve green band status, and avoid penalties. ...
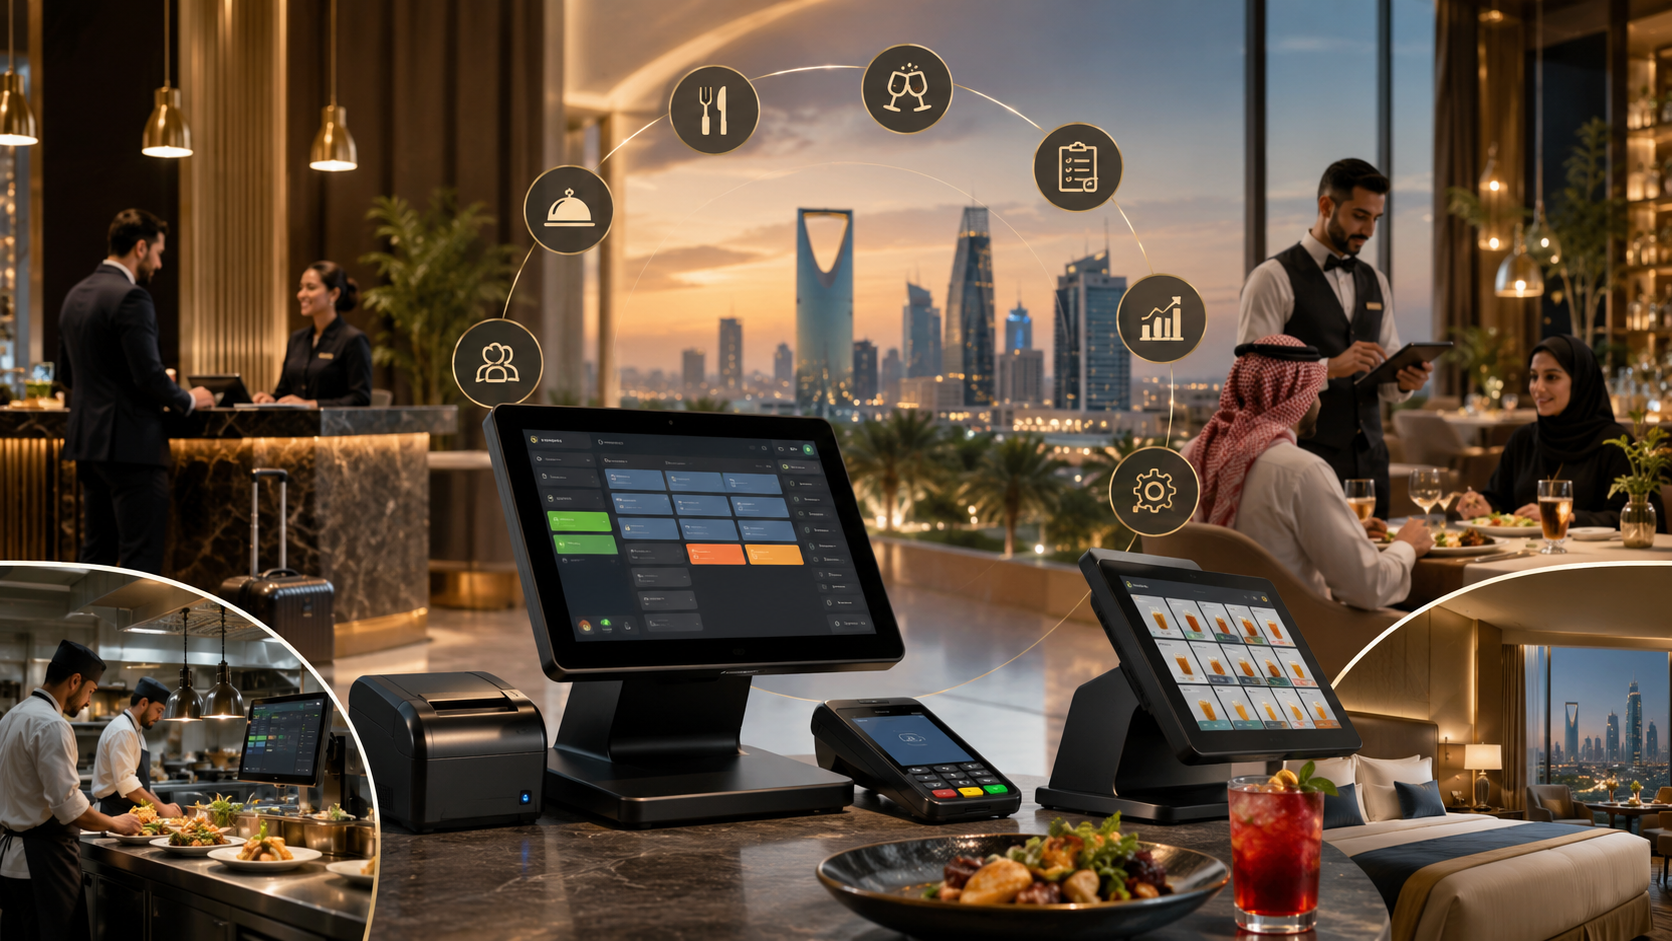
Master connecting hotel restaurant, café, and room service billing with your PMS — ZATCA-compliant, Mada, STC Pay ready. Guide for Saudi hotels Vision 2030....
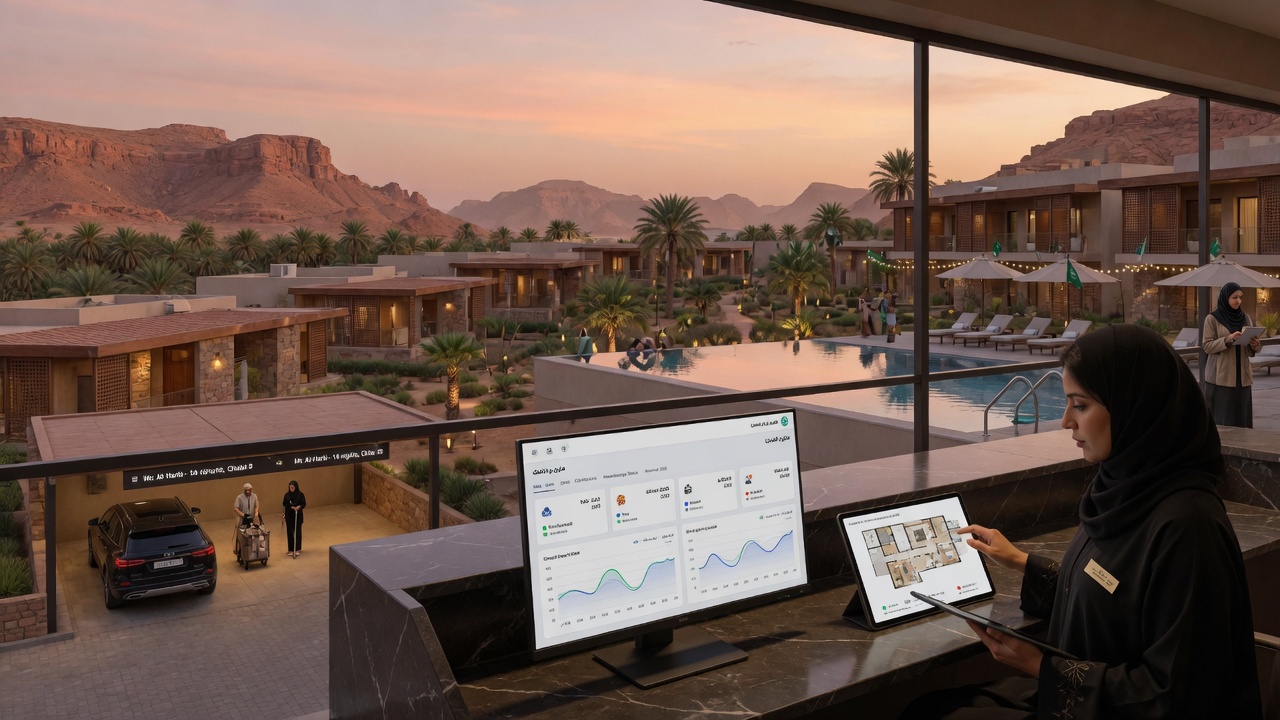
Discover the best hotel PMS for serviced apartments and chalets in Saudi Arabia. Streamline operations, boost direct bookings, and ensure Shomoos compliance in 2026....
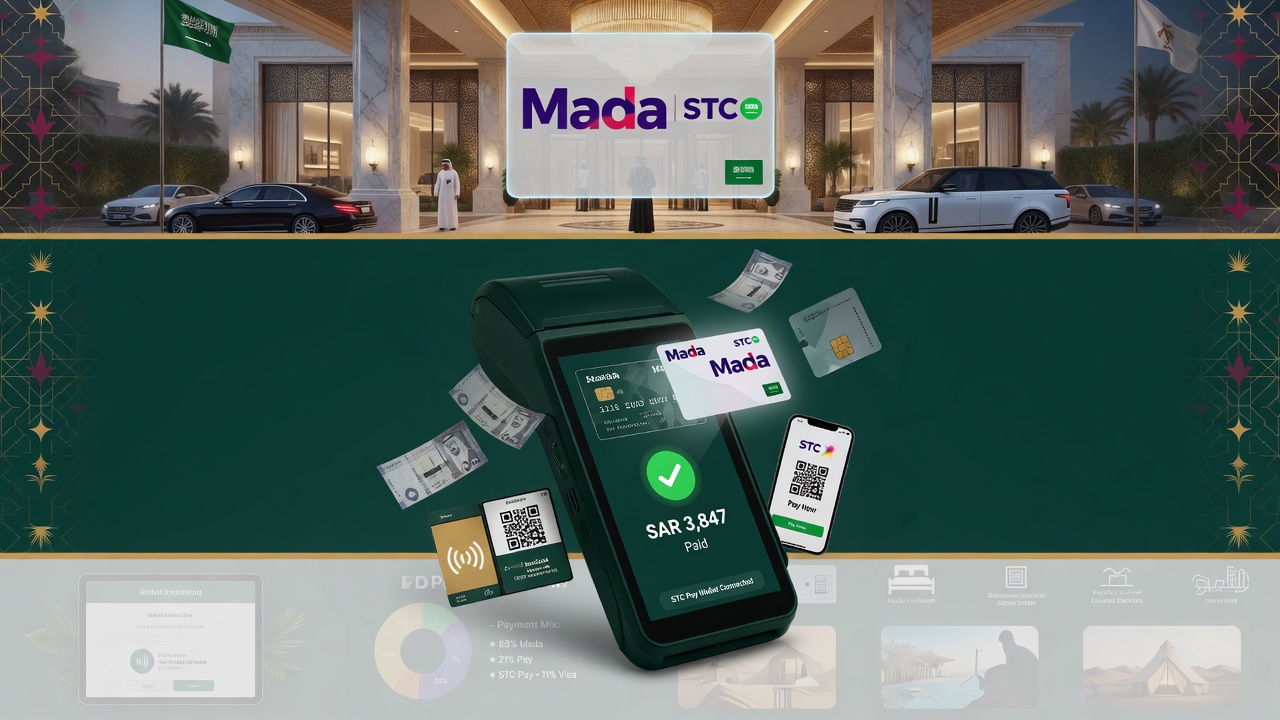
Compare top Saudi hotel payment gateways with Mada & STC Pay. Boost direct bookings with SAMA-compliant, ZATCA-ready solutions like HyperPay, PayTabs....
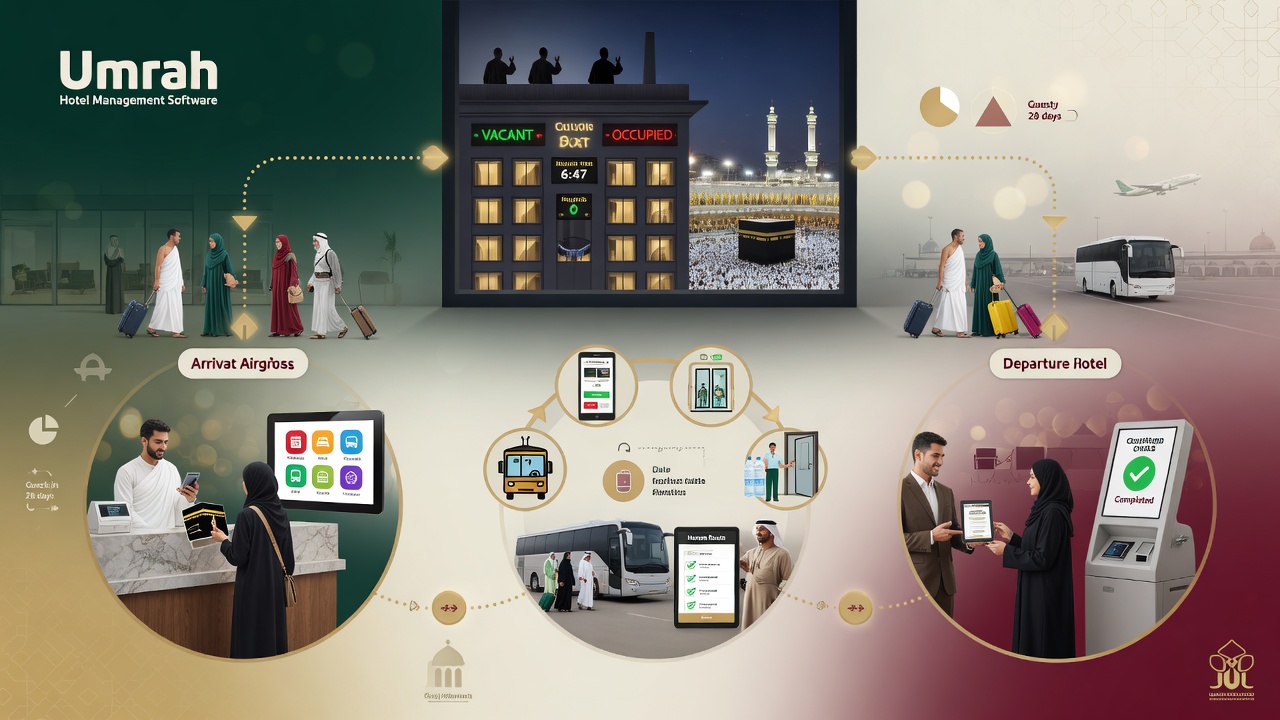
Streamline Umrah & Hajj pilgrim stays with automation. Bulk check‑ins, prayer‑aware services, Nusuk integration & Vision 2030 compliance for Saudi hotels....
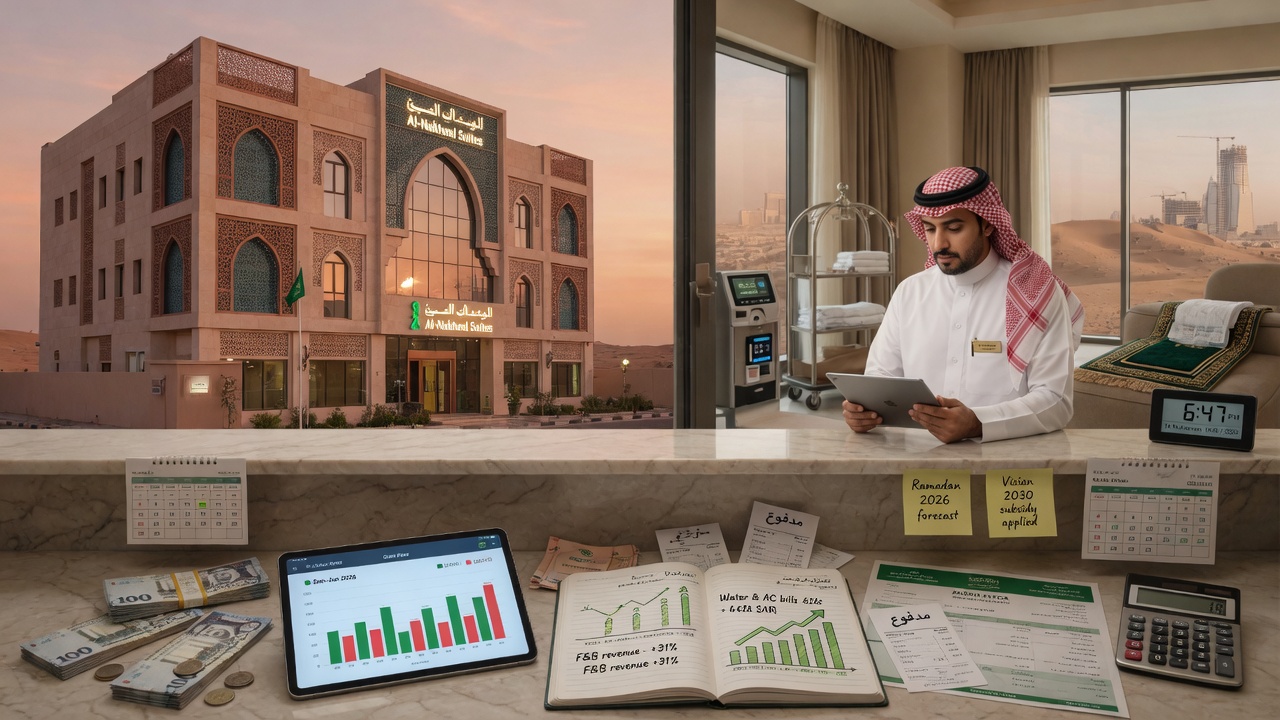
Master cash flow management for small hotels in Saudi Arabia. Our 2026 guide covers seasonal planning, cost control, and profit optimization....

Safeguard guest data in Saudi hotels with our expert guide covering NCA, PDPL, PCI DSS compliance, ransomware prevention, and cybersecurity best practices....

Learn how to increase direct hotel bookings in Saudi Arabia, cut OTA commissions, and boost profit with direct booking engine, loyalty program & best-rate....
Discover how Cloud PMS technology accelerates Saudi Vision 2030 tourism goals. Improve hotel efficiency and guest experience with digital transformation in KSA....

Learn how AI in Saudi hotels boosts revenue through dynamic pricing, chatbots, and guest personalization. Start your smart hospitality transformation....

Master seasonal demand in Saudi Arabia. Learn how to optimize hotel revenue during Hajj and Umrah using automated PMS, dynamic pricing, and channel managers...
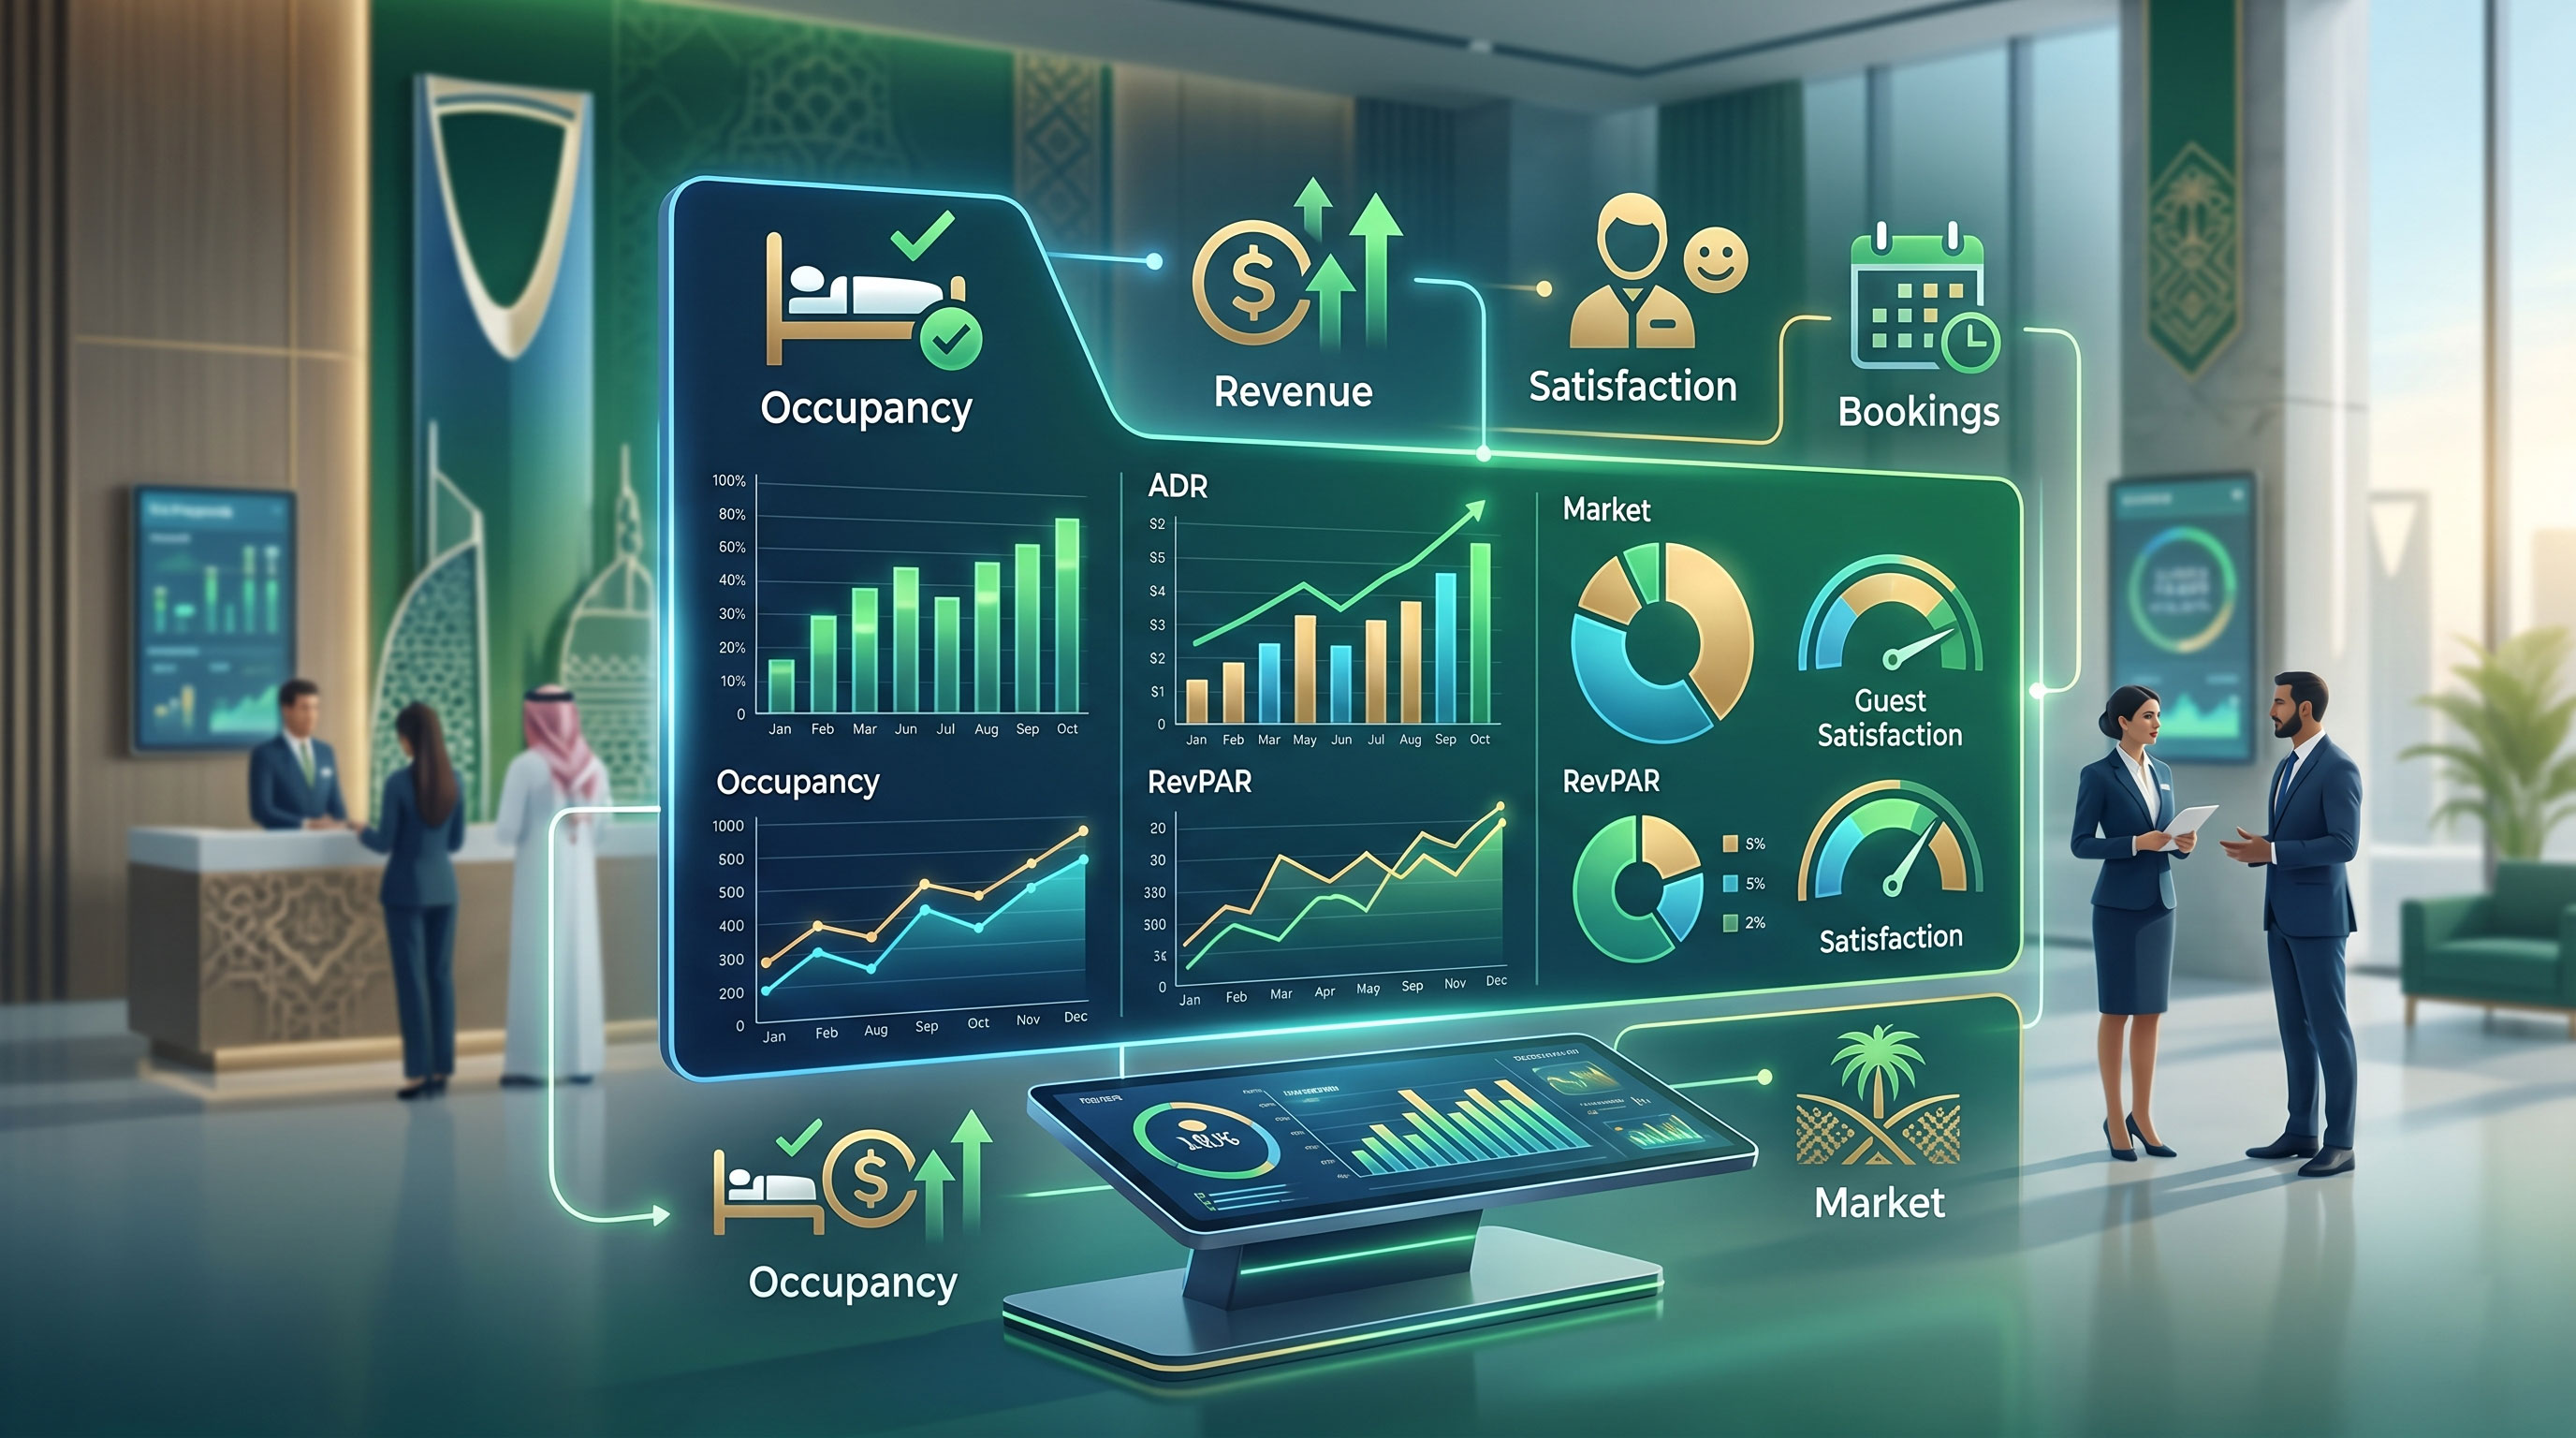
Discover essential daily KPIs every hotel owner in Saudi Arabia should track with a BI dashboard. Boost RevPAR, compliance, and profit with data-driven insights....
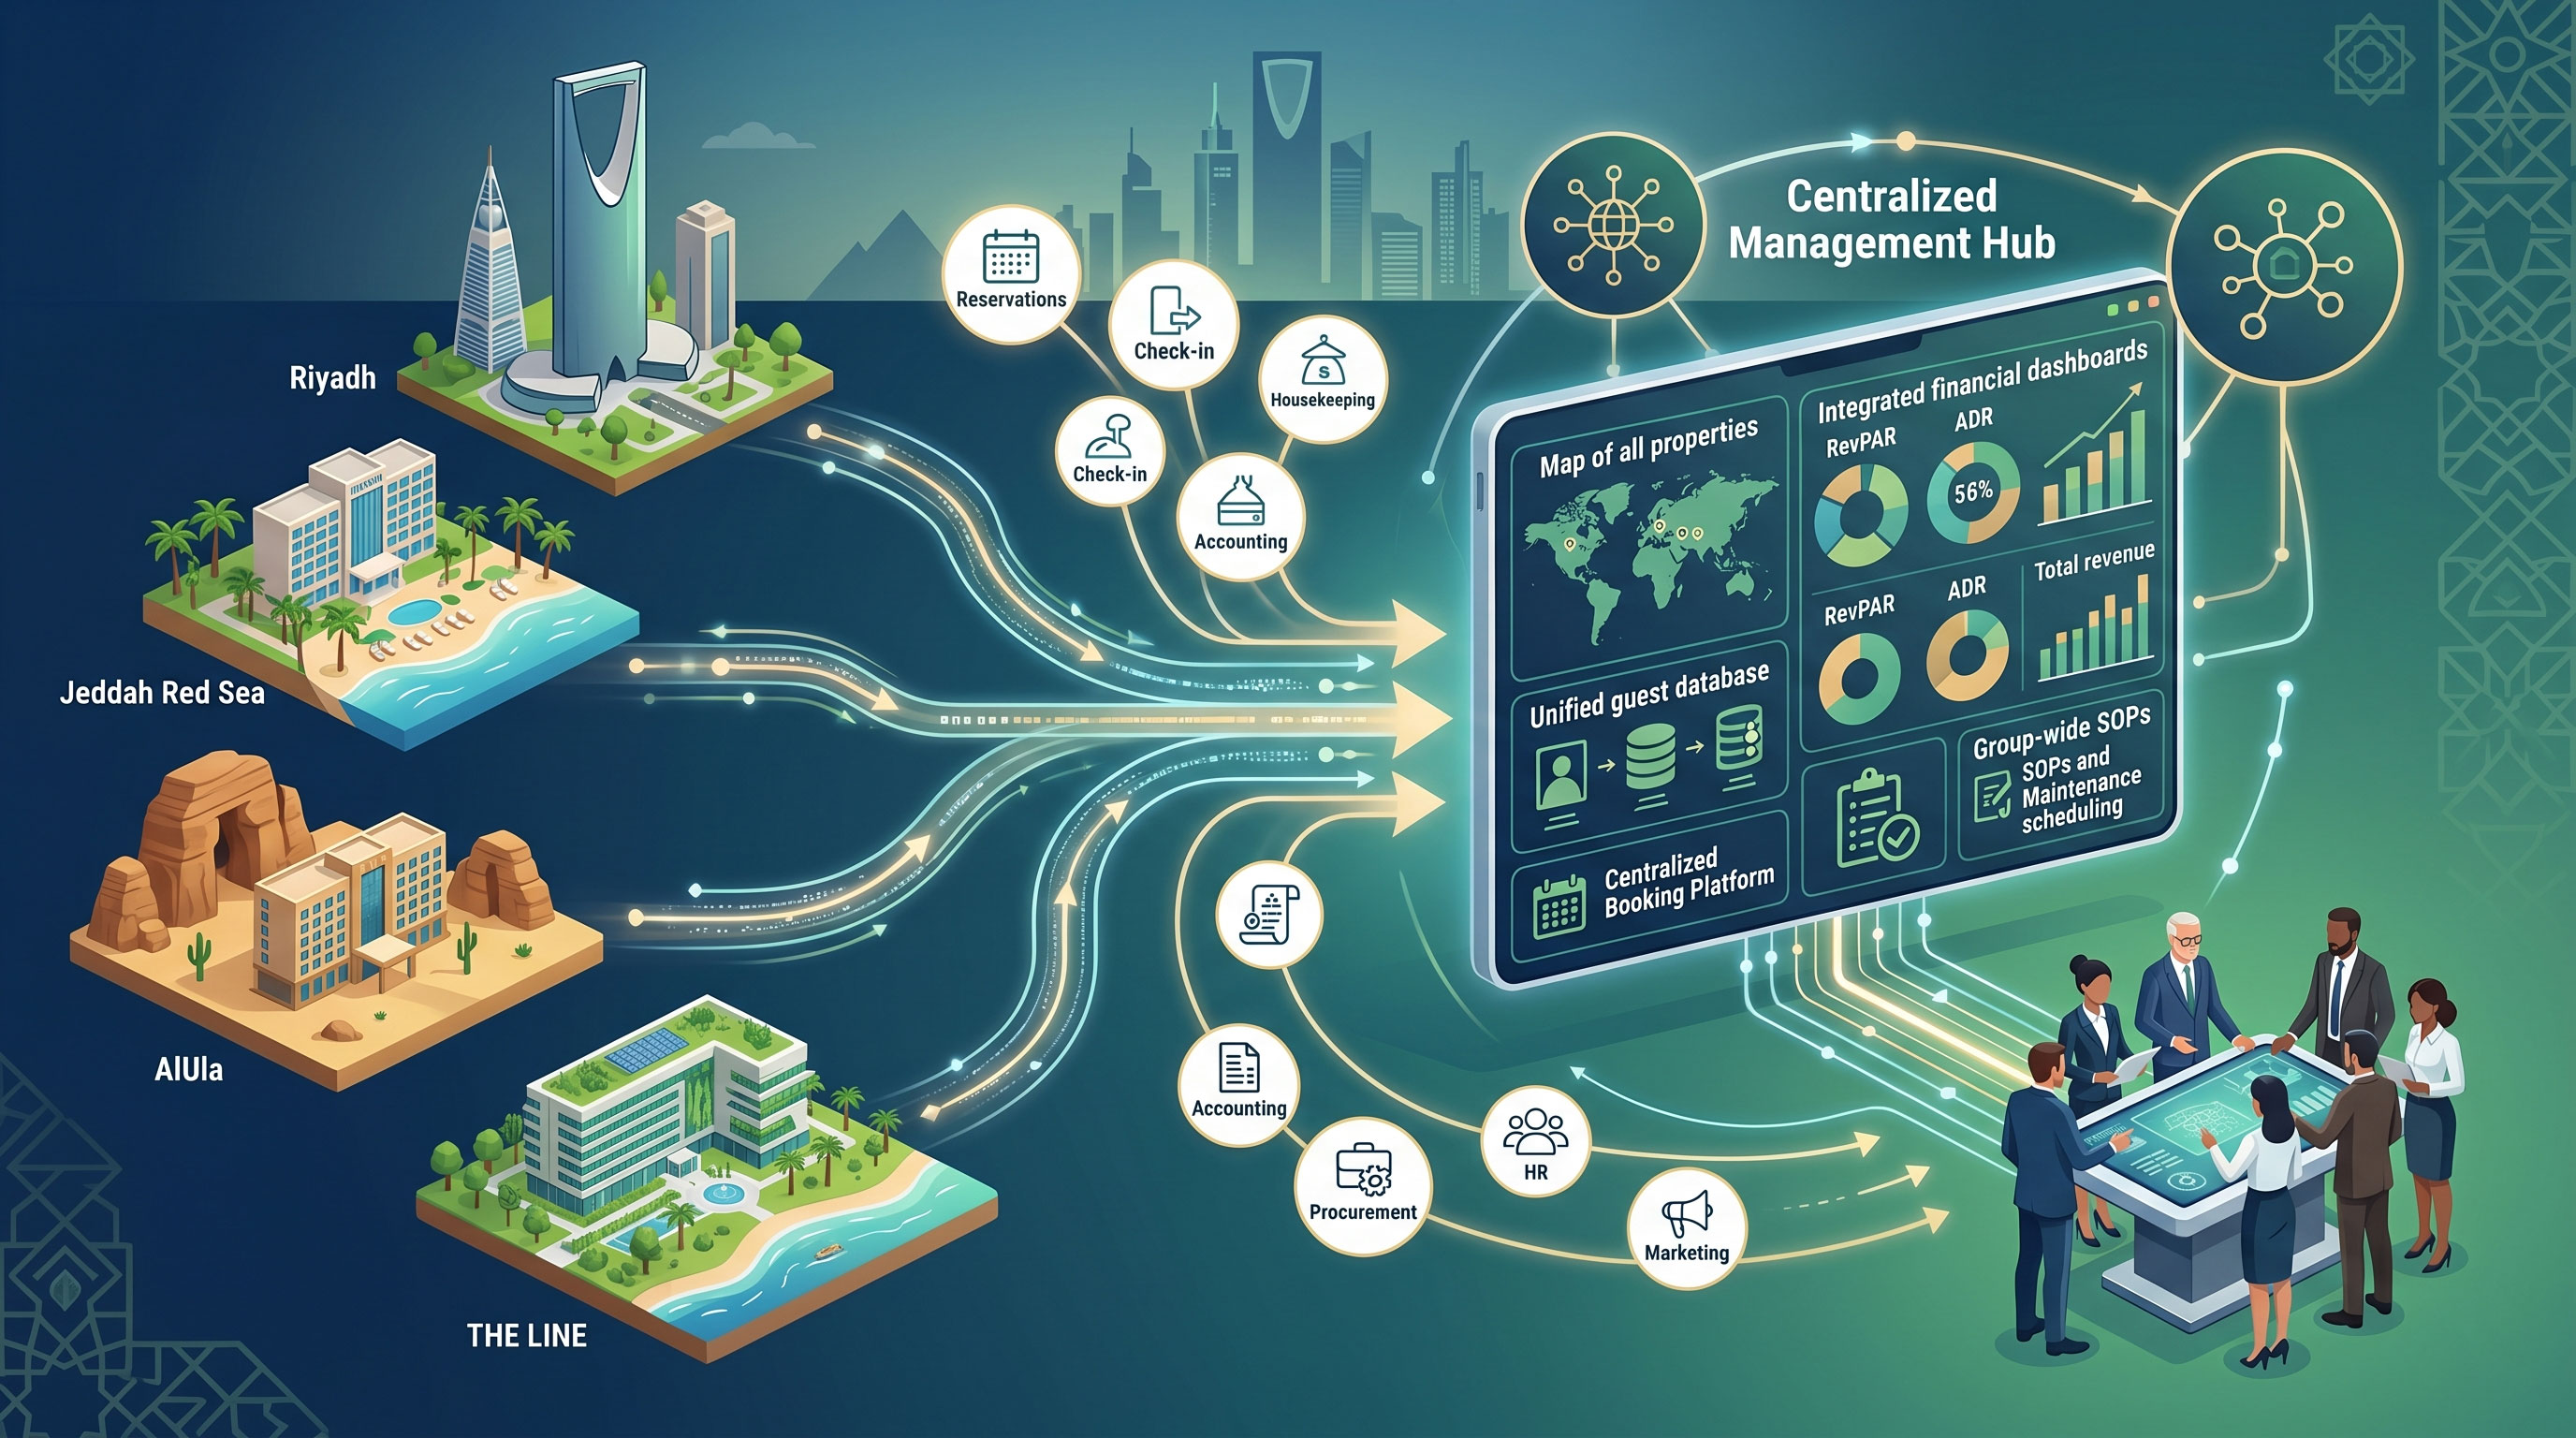
Centralize hotel operations in Saudi Arabia: multi-property management, unified reporting, revenue optimization, procurement, HR, and ZATCA compliance for Vision 2030 growth....
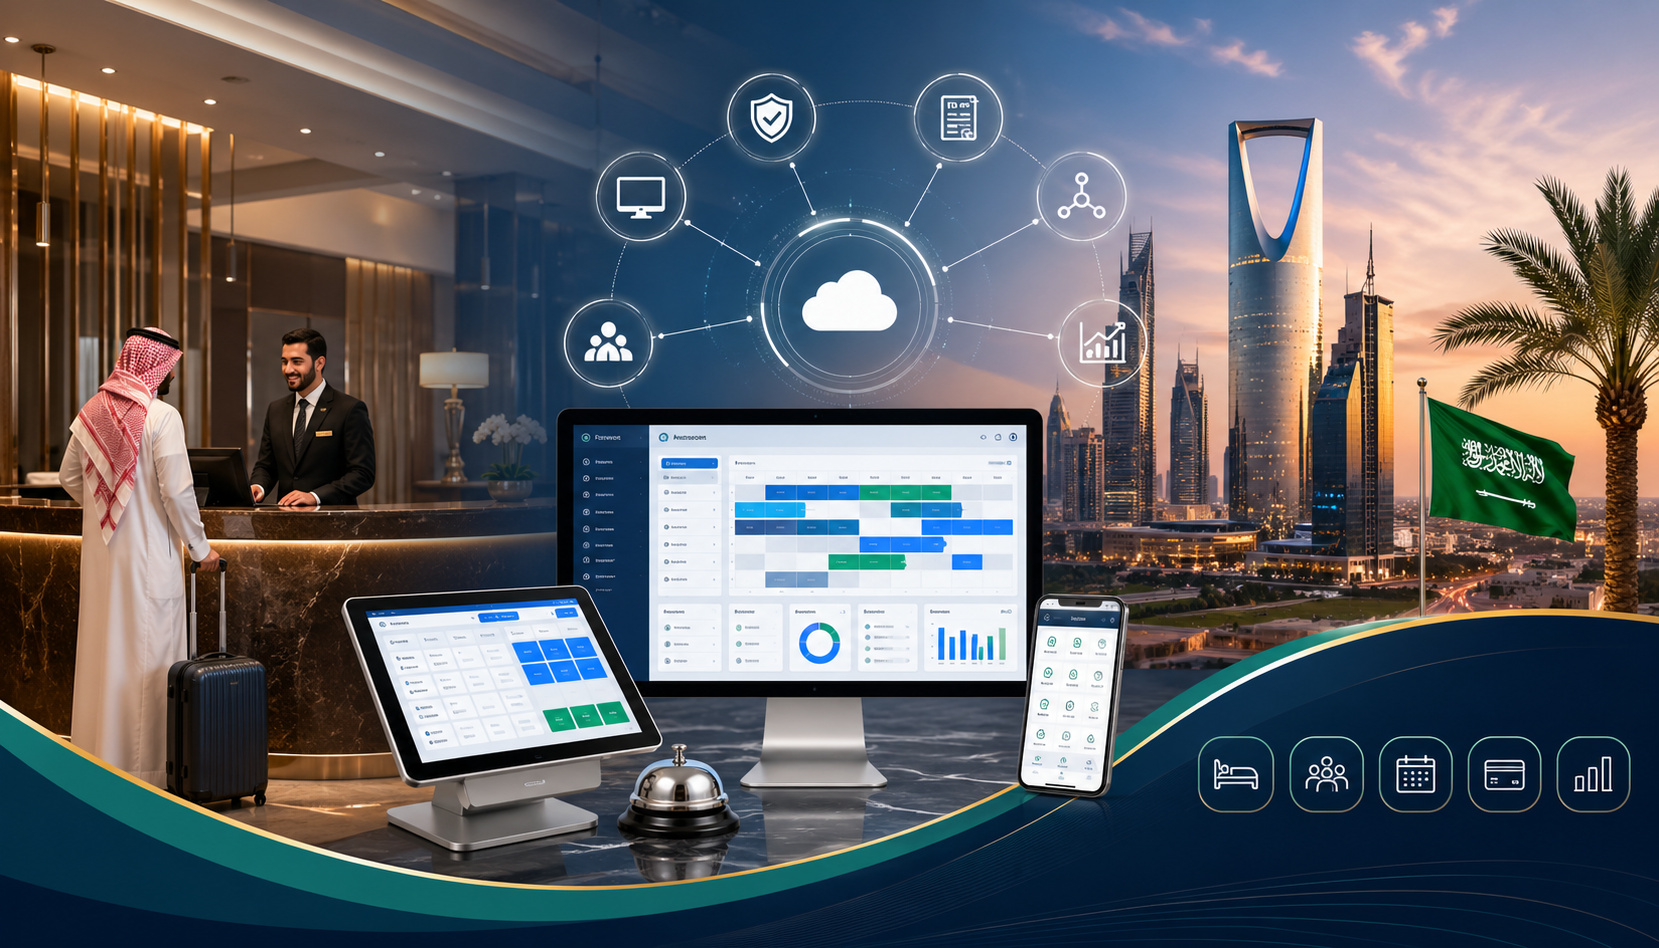
Compare what Saudi hotels need in 2026: cloud PMS, ZATCA e-invoicing, Shomoos, Ministry of Tourism, channel manager, booking engine, automation, and guest management....
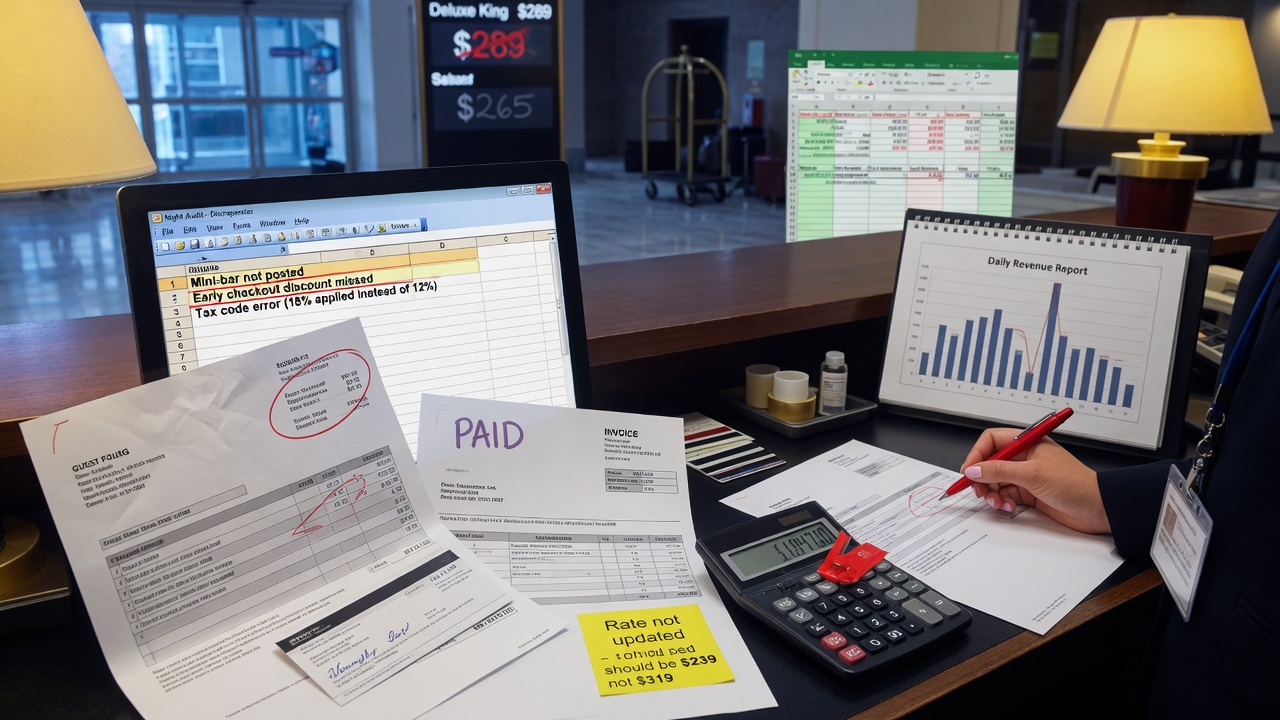
Top common hotel billing errors in Saudi hotels cost SAR 100K+ yearly via VAT & fee mistakes. Stop leakage with ZATCA PMS automation now....
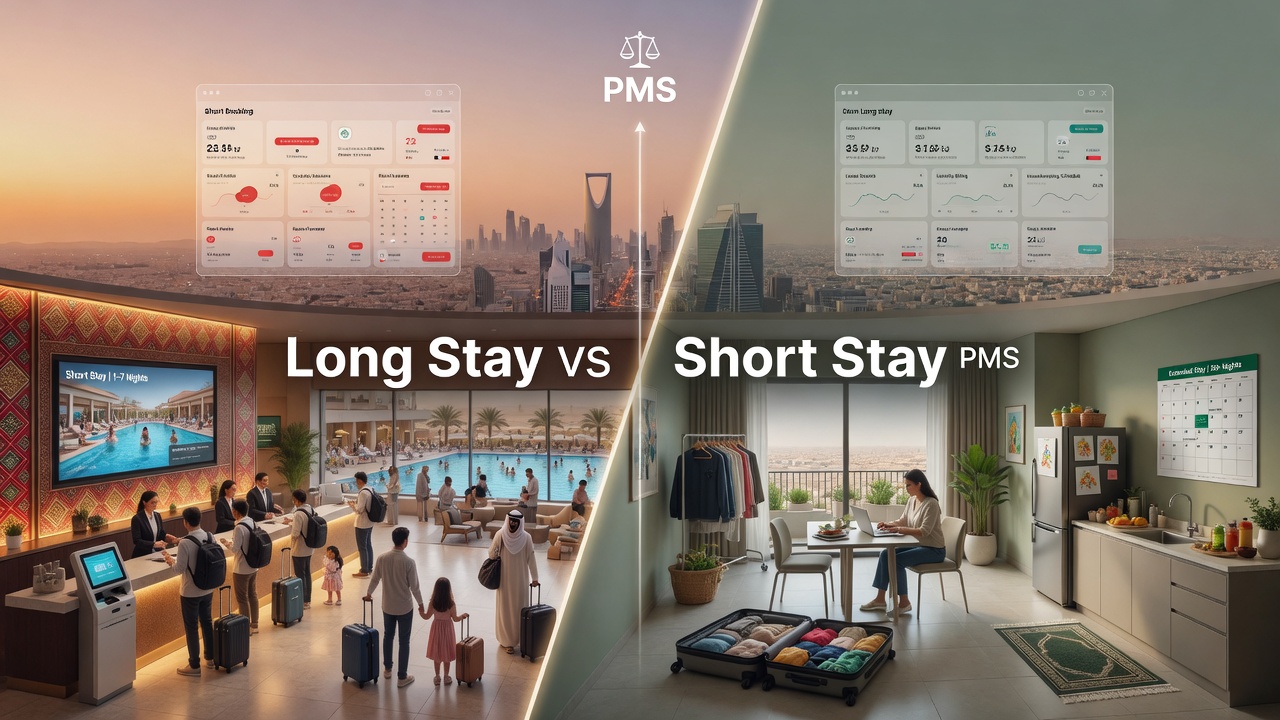
Compare long stay vs short stay PMS for Saudi hospitality. Learn key differences, must‑have features, Ejar compliance, and Vision 2030 insights...
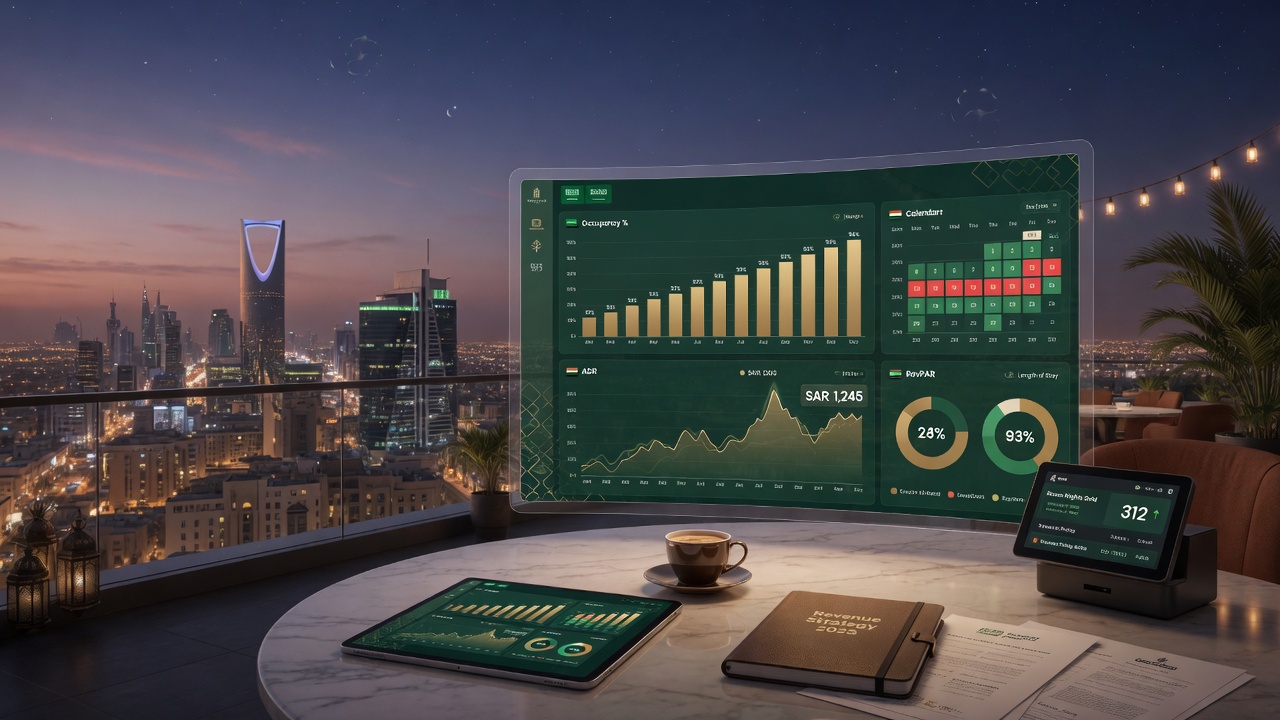
Compare what Saudi hotels need in 2026: cloud PMS, ZATCA e-invoicing, Shomoos, Ministry of Tourism, channel manager, booking engine, automation, and guest management....
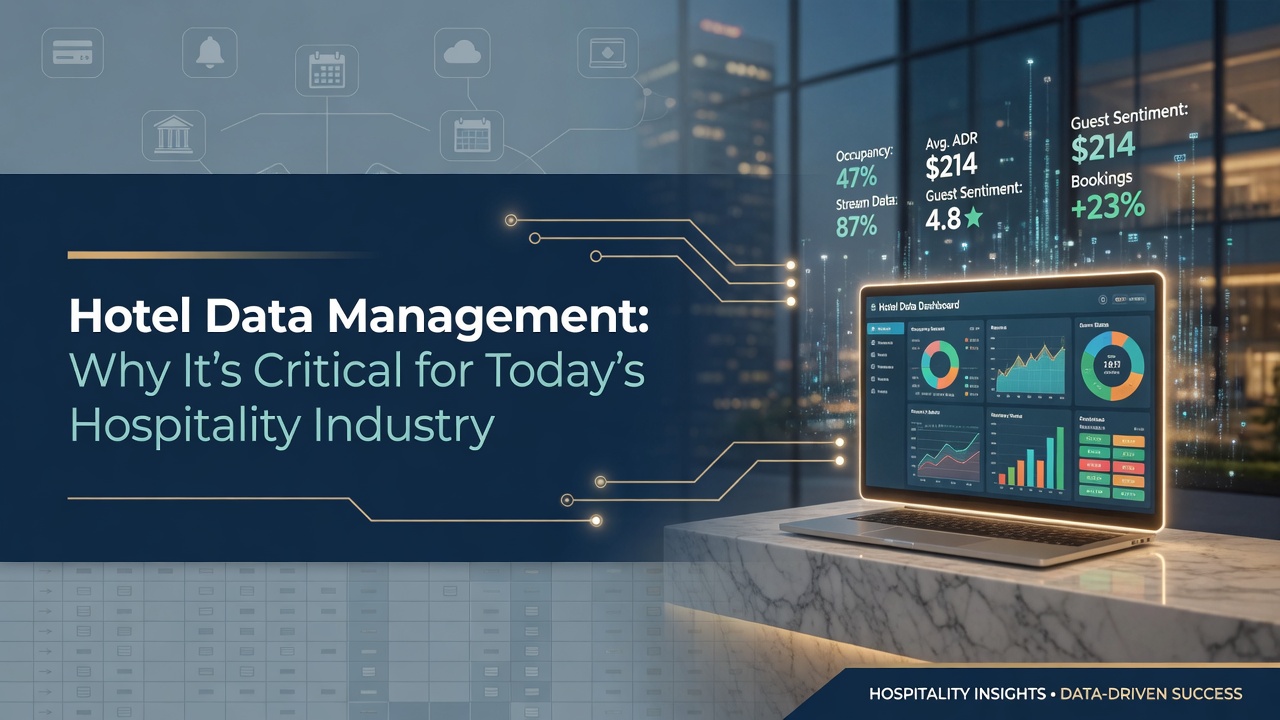
Discover why hotel data management is essential for Saudi hotels. Learn how to leverage guest insights, ensure ZATCA & Shomoos compliance, and boost revenue with a modern PMS. Free demo from Fandaqah...

Vision 2030 is transforming vacation ownership in Saudi Arabia. Explore the hotel meets residential trend at Red Sea Global and NEOM for families and investors....
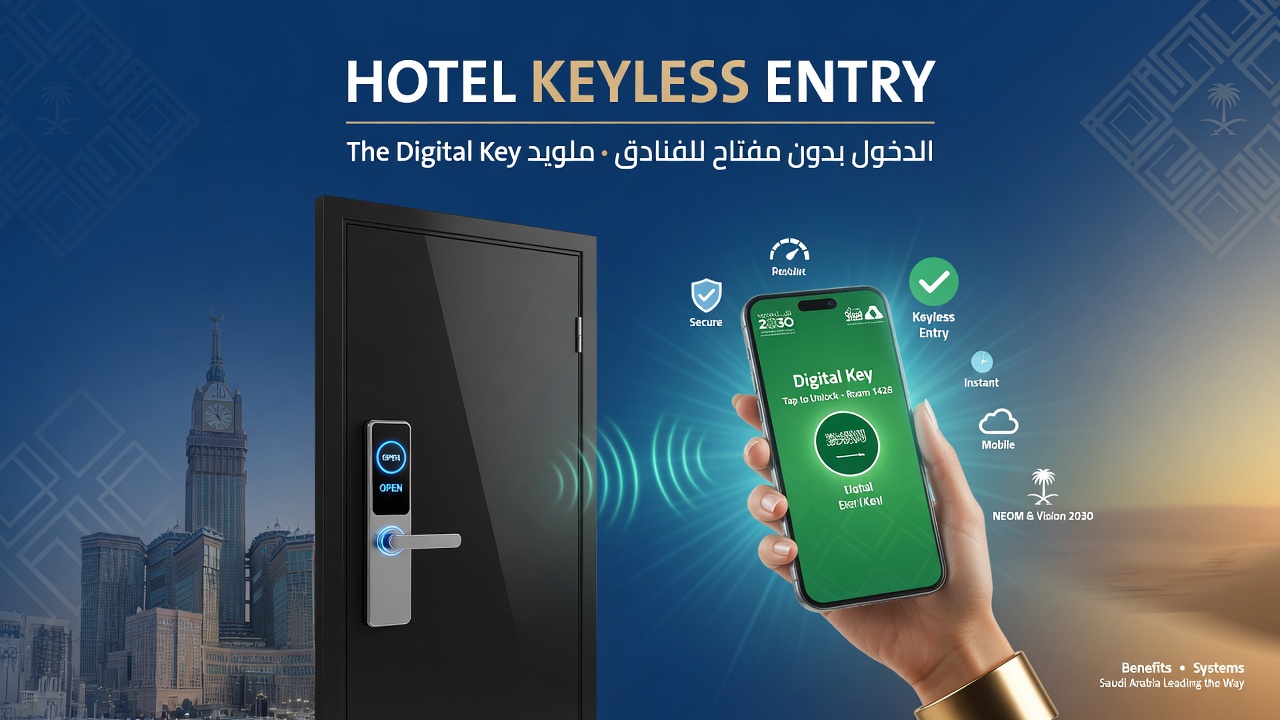
Saudi Arabia hotel keyless entry under Vision 2030: mobile keys, biometrics, guest benefits, hotel savings, Mövenpick Riyadh and Red Sea Global case studies....

Legacy PMS is silently costing Saudi hotels guests, direct bookings, and revenue through slow operations, poor personalization, and lost opportunities. Discover the true hidden costs of outdated hotel...
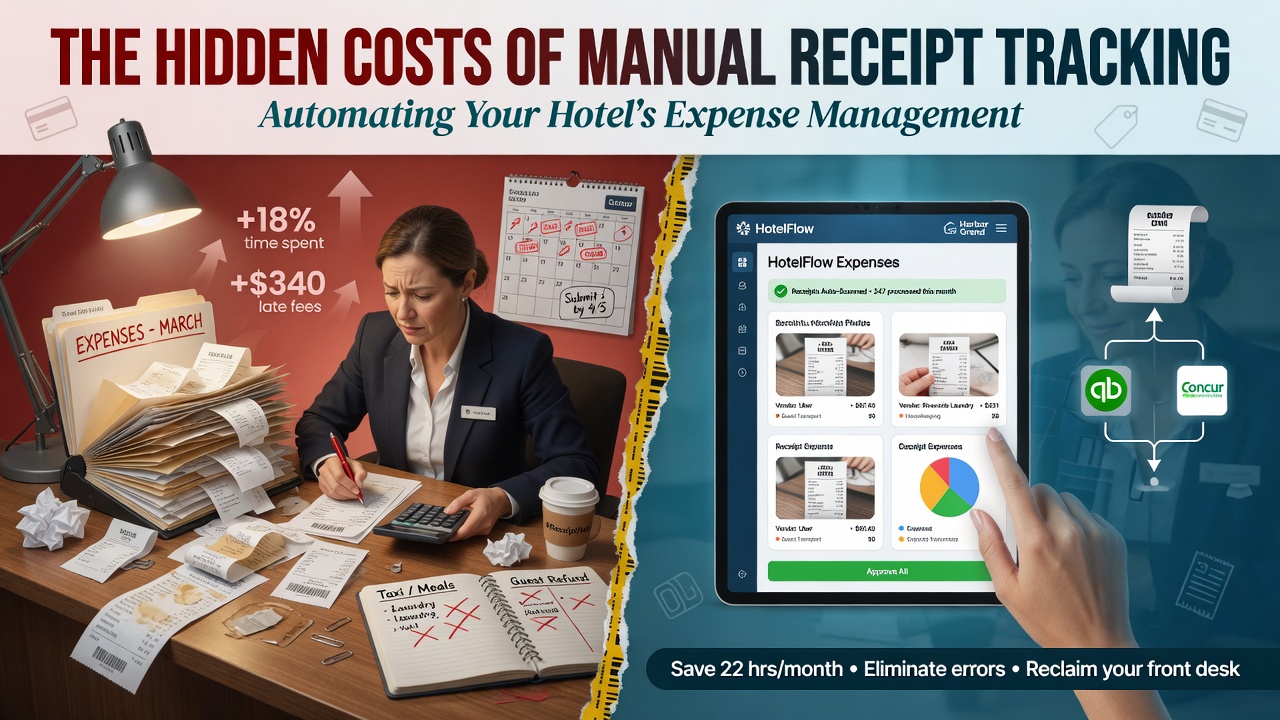
Saudi hotels lose tens of thousands of SAR yearly on manual receipt tracking. Discover hidden costs — wasted labor, VAT leakage, fraud & ZATCA risks — and how automated expense management software...

Discover how AI, IoT, and smart building tech are driving sustainable hotel operations in Saudi Arabia. Reduce costs, meet Vision 2030 goals, and enhance guest experience....
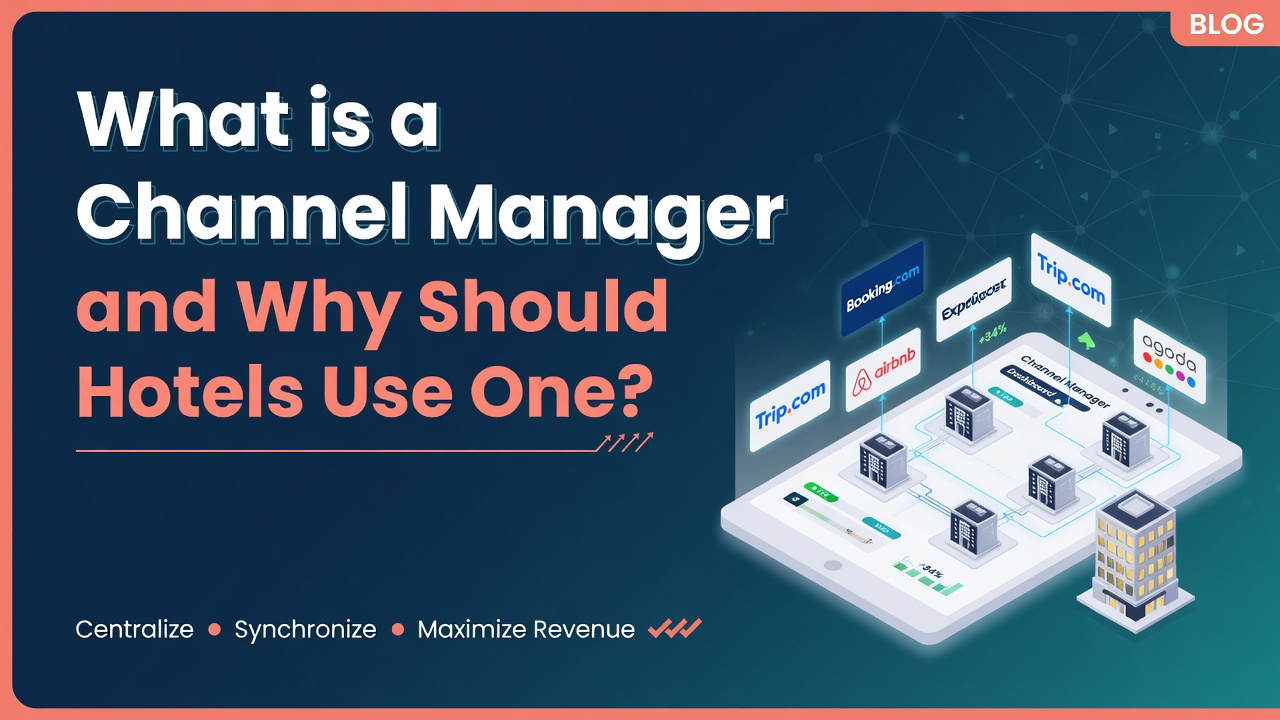
Discover what a channel manager is and why Saudi hotels need it. Automate OTA distribution, prevent overbookings, boost direct bookings, and stay compliant. Free demo from Fandaqah...

Reduce hotel check-in time from 15 minutes to under 3 minutes using automated Shomoos registration and passport scanning. Free demo for Saudi hotels...

Discover how smart room integration with hotel PMS in Saudi Arabia enhances guest experience, energy efficiency, and compliance with ZATCA & Shomoos. The future of Vision 2030 hospitality starts here....
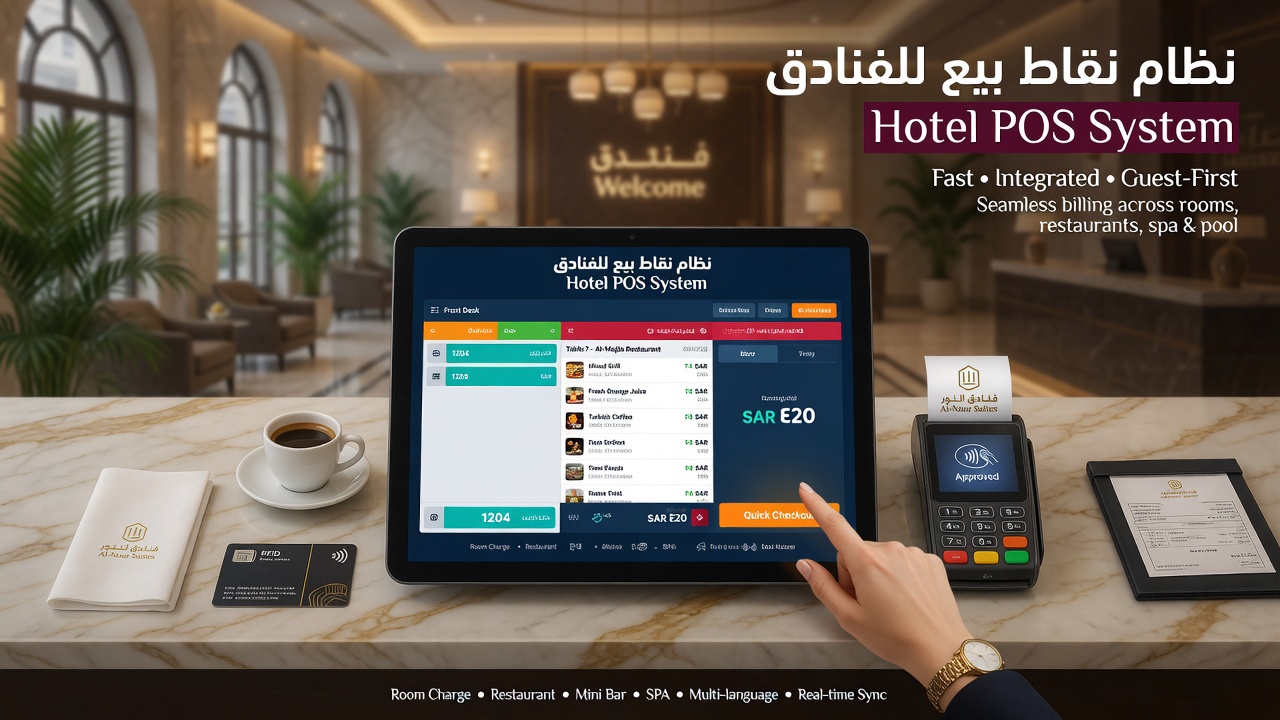
Discover why Arabic interface and POS integration are essential for hotels in Saudi Arabia. Boost staff efficiency, guest satisfaction, and compliance with Fandaqah’s all-in-one PMS...
Try Fandaqah’s 30‑day free demo account for hotel PMS in Saudi Arabia. Experience ZATCA e‑invoicing, Shomoos integration, passport scanning, and check‑in automation – risk‑free. Start your...
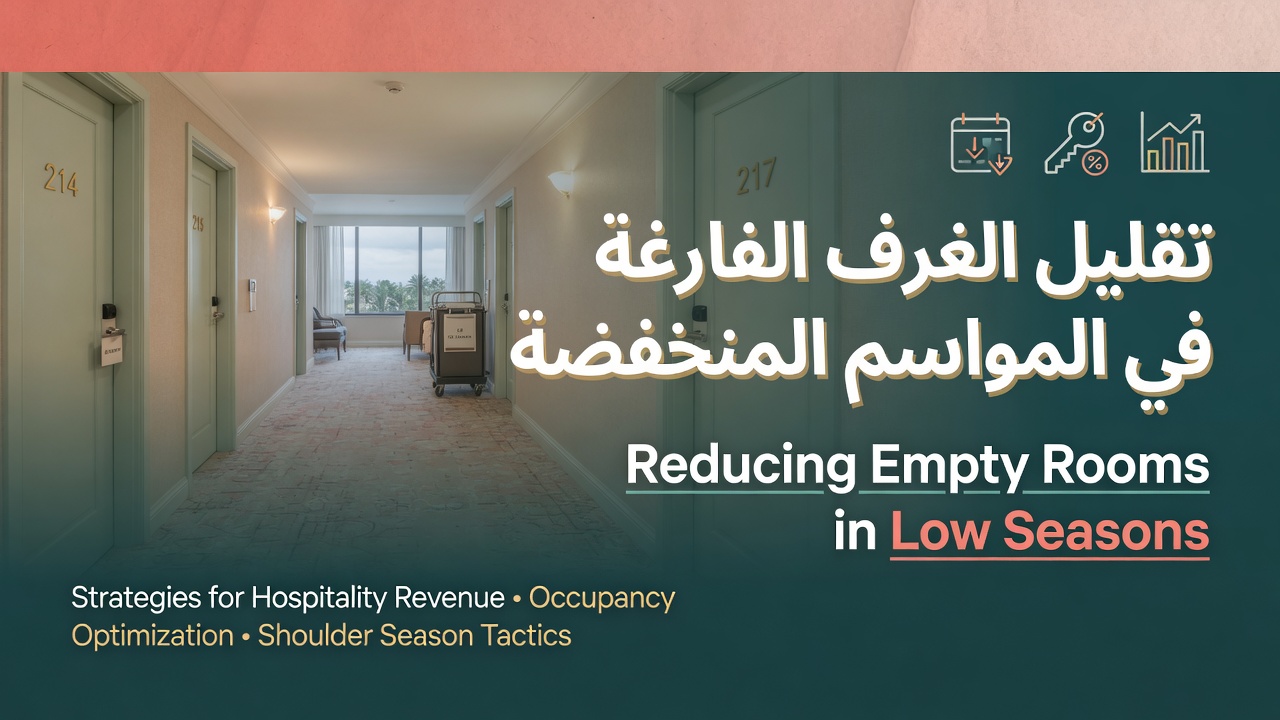
Discover proven strategies to avoid empty rooms during low season in Saudi Arabia. Learn dynamic pricing, direct booking tactics, and how a hotel PMS Saudi Arabia can boost occupancy year‑round. Fre...
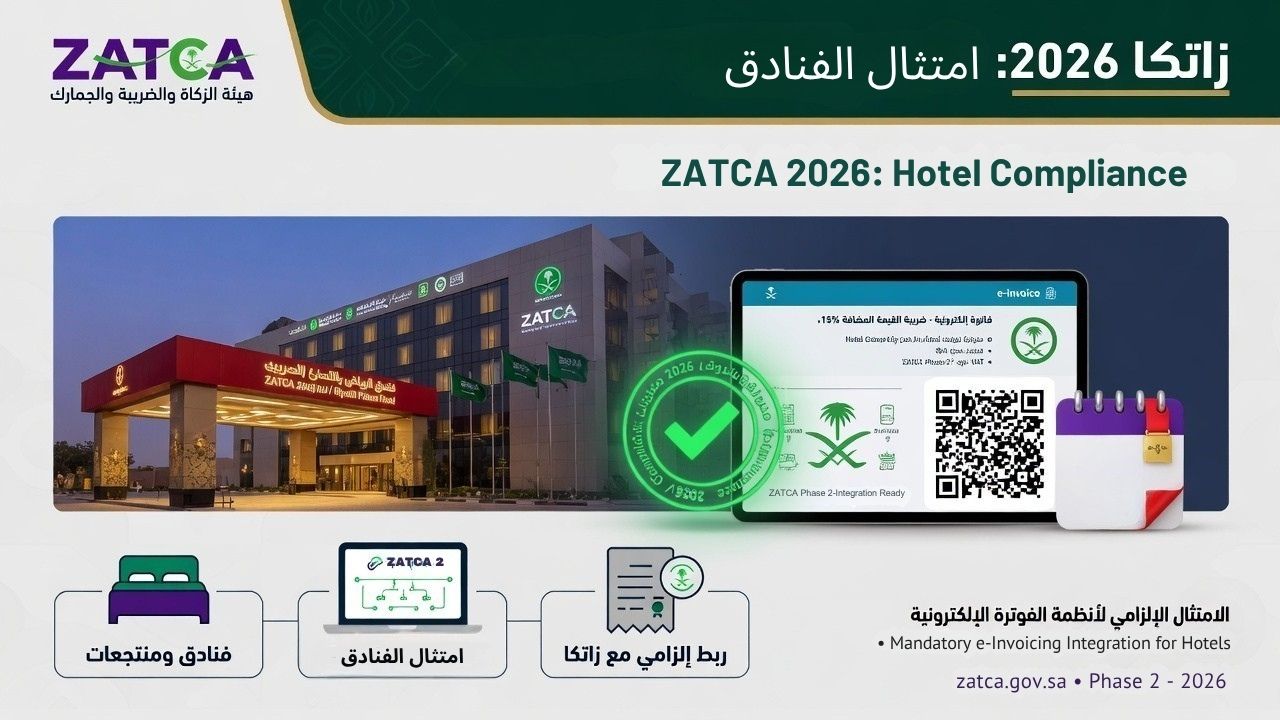
ZATCA Phase 2 deadline for hotels: March 31, 2026. Learn Wave 23 requirements, e-invoicing integration, penalties, and how a compliant hotel PMS ensures full compliance. Free demo from Fandaqah...
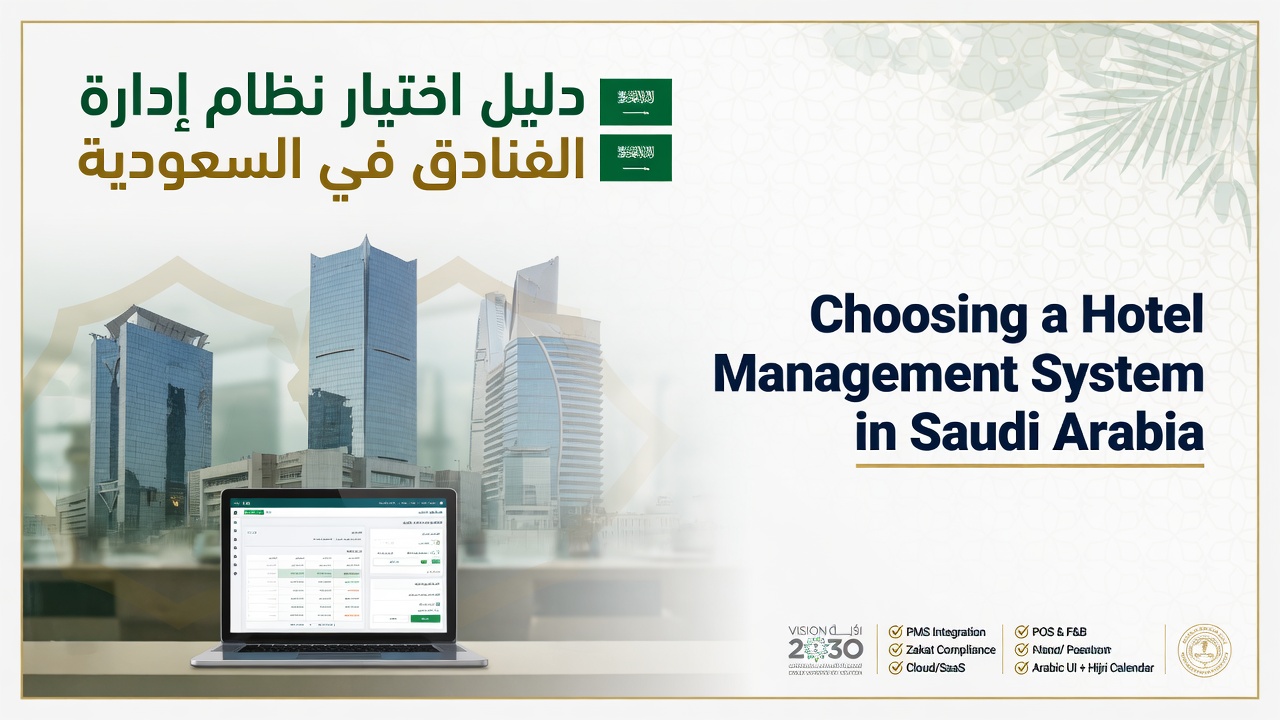
Complete guide to buying a hotel PMS in Saudi Arabia. Learn key features, compliance with ZATCA & Shomoos, ROI, and how to choose the best hotel management system KSA for your property...
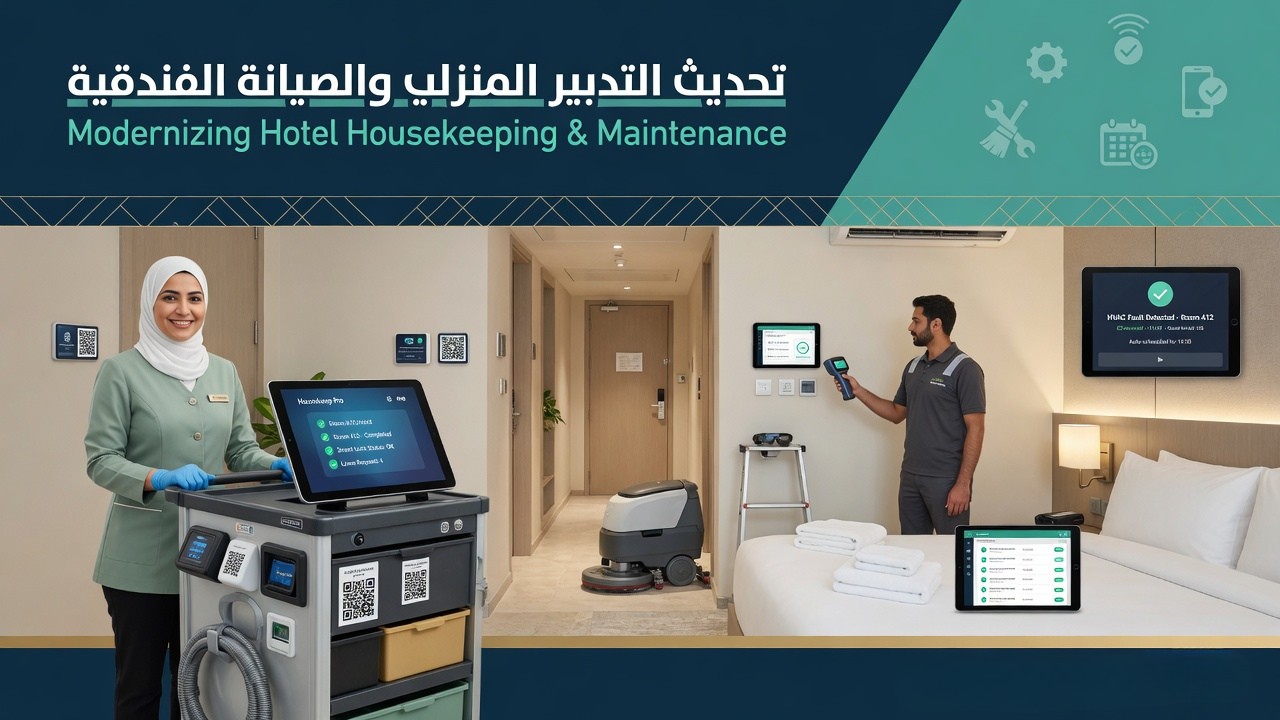
Go paperless with hotel housekeeping and maintenance. Learn how digital checklists, real‑time updates, and integrated PMS boost efficiency, guest satisfaction, and compliance in Saudi Arabia...
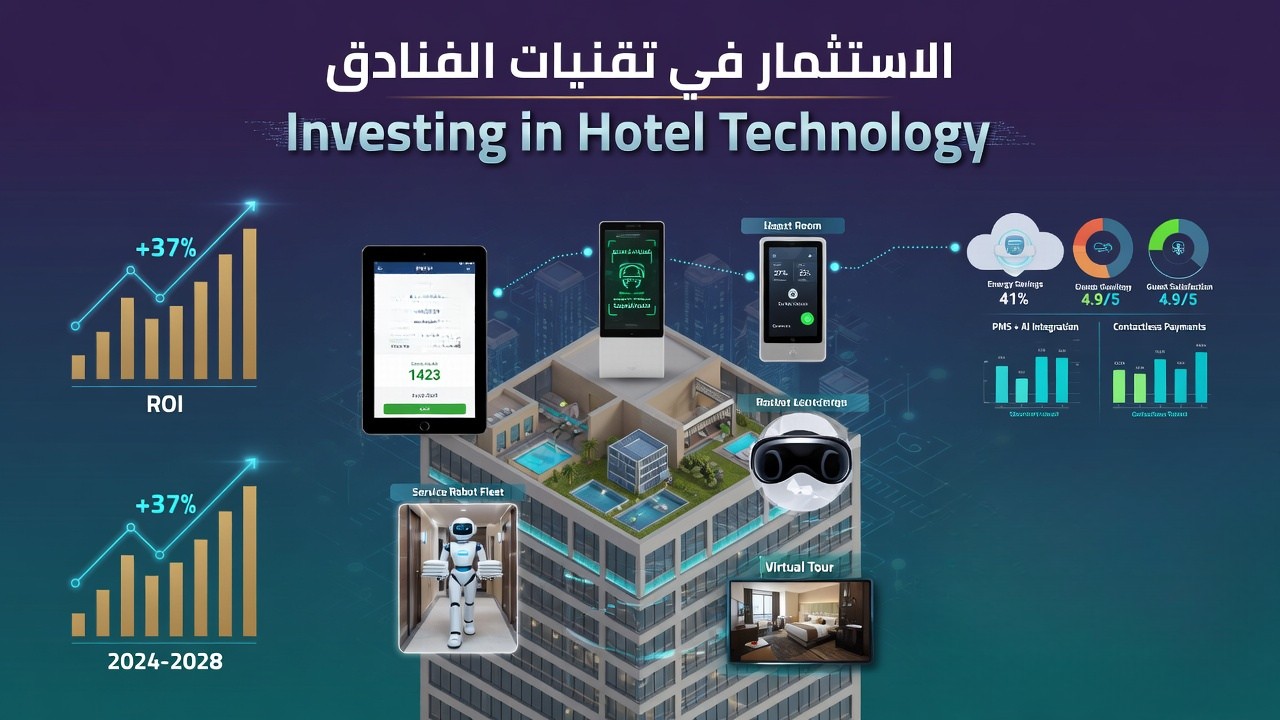
Learn how hoteliers can build a business case for new technology. Show ROI, improve guest satisfaction, and ensure ZATCA & Shomoos compliance. Free demo for Saudi hotels...
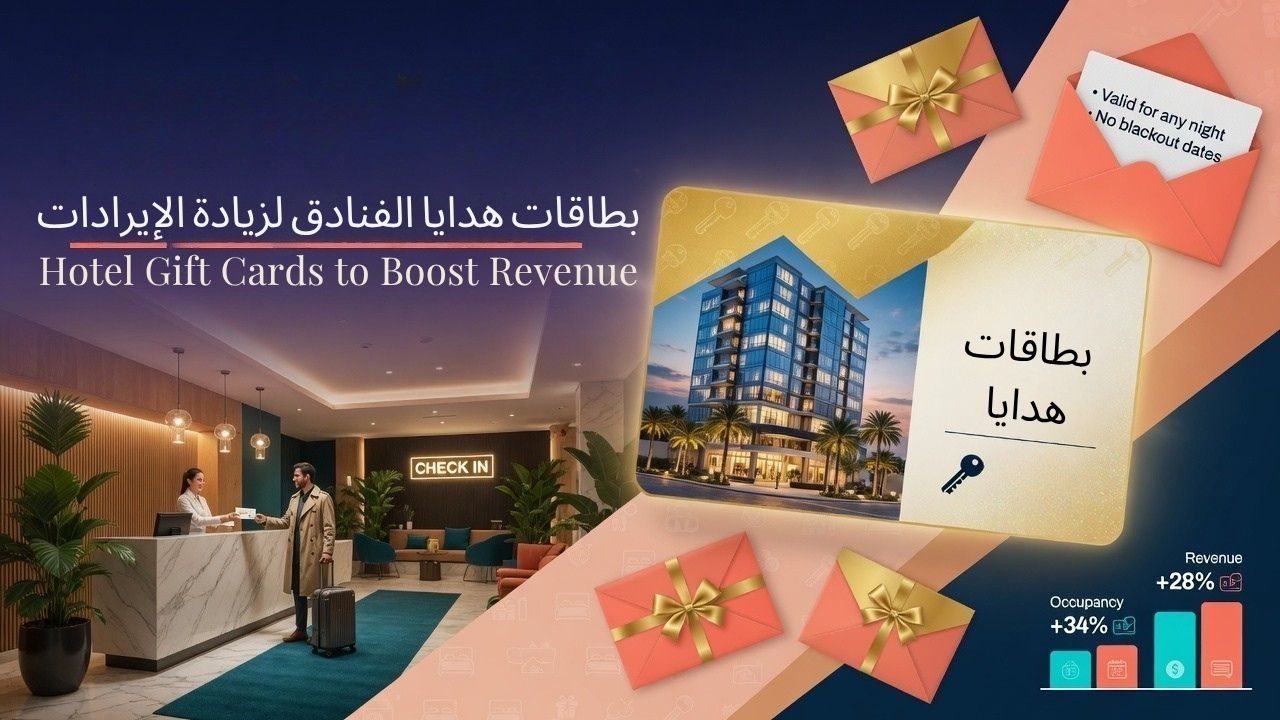
Discover how gift cards for hotels can boost occupancy, increase revenue, and attract new guests. Learn to integrate with your hotel PMS Saudi Arabia for seamless automation....

Discover proven destination marketing ideas for hotels in Saudi Arabia. Attract more guests, leverage Vision 2030, and boost direct bookings. Free consultation inside....

Hostel vs hotel – what's the difference? Compare cost, privacy, amenities, and social experience. Perfect for Saudi travelers and tourists under Vision 2030. Find your ideal stay....
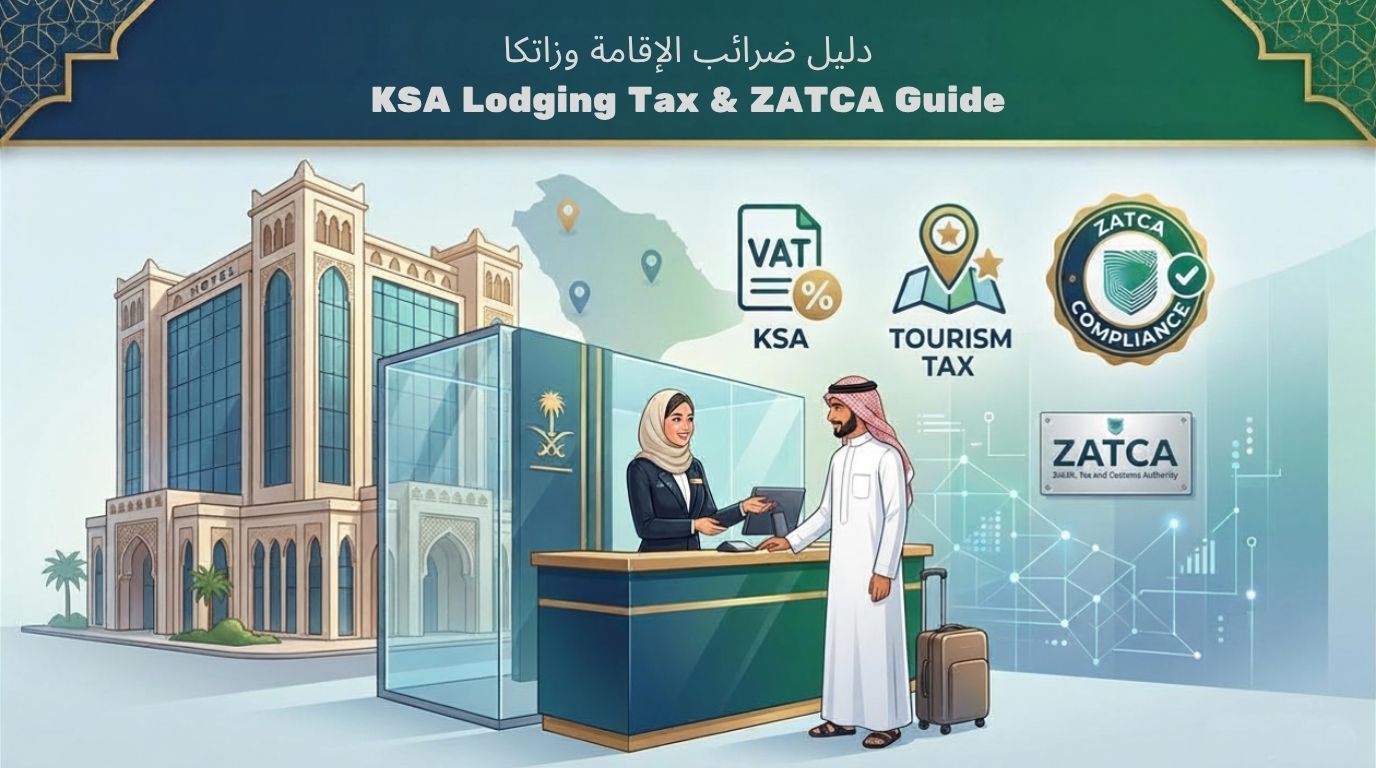
Complete guide to lodging taxes for hotels in Saudi Arabia: VAT (15%), municipality fees, tourism tax, ZATCA e-invoicing compliance, and how to automate tax management. Essential for hoteliers....
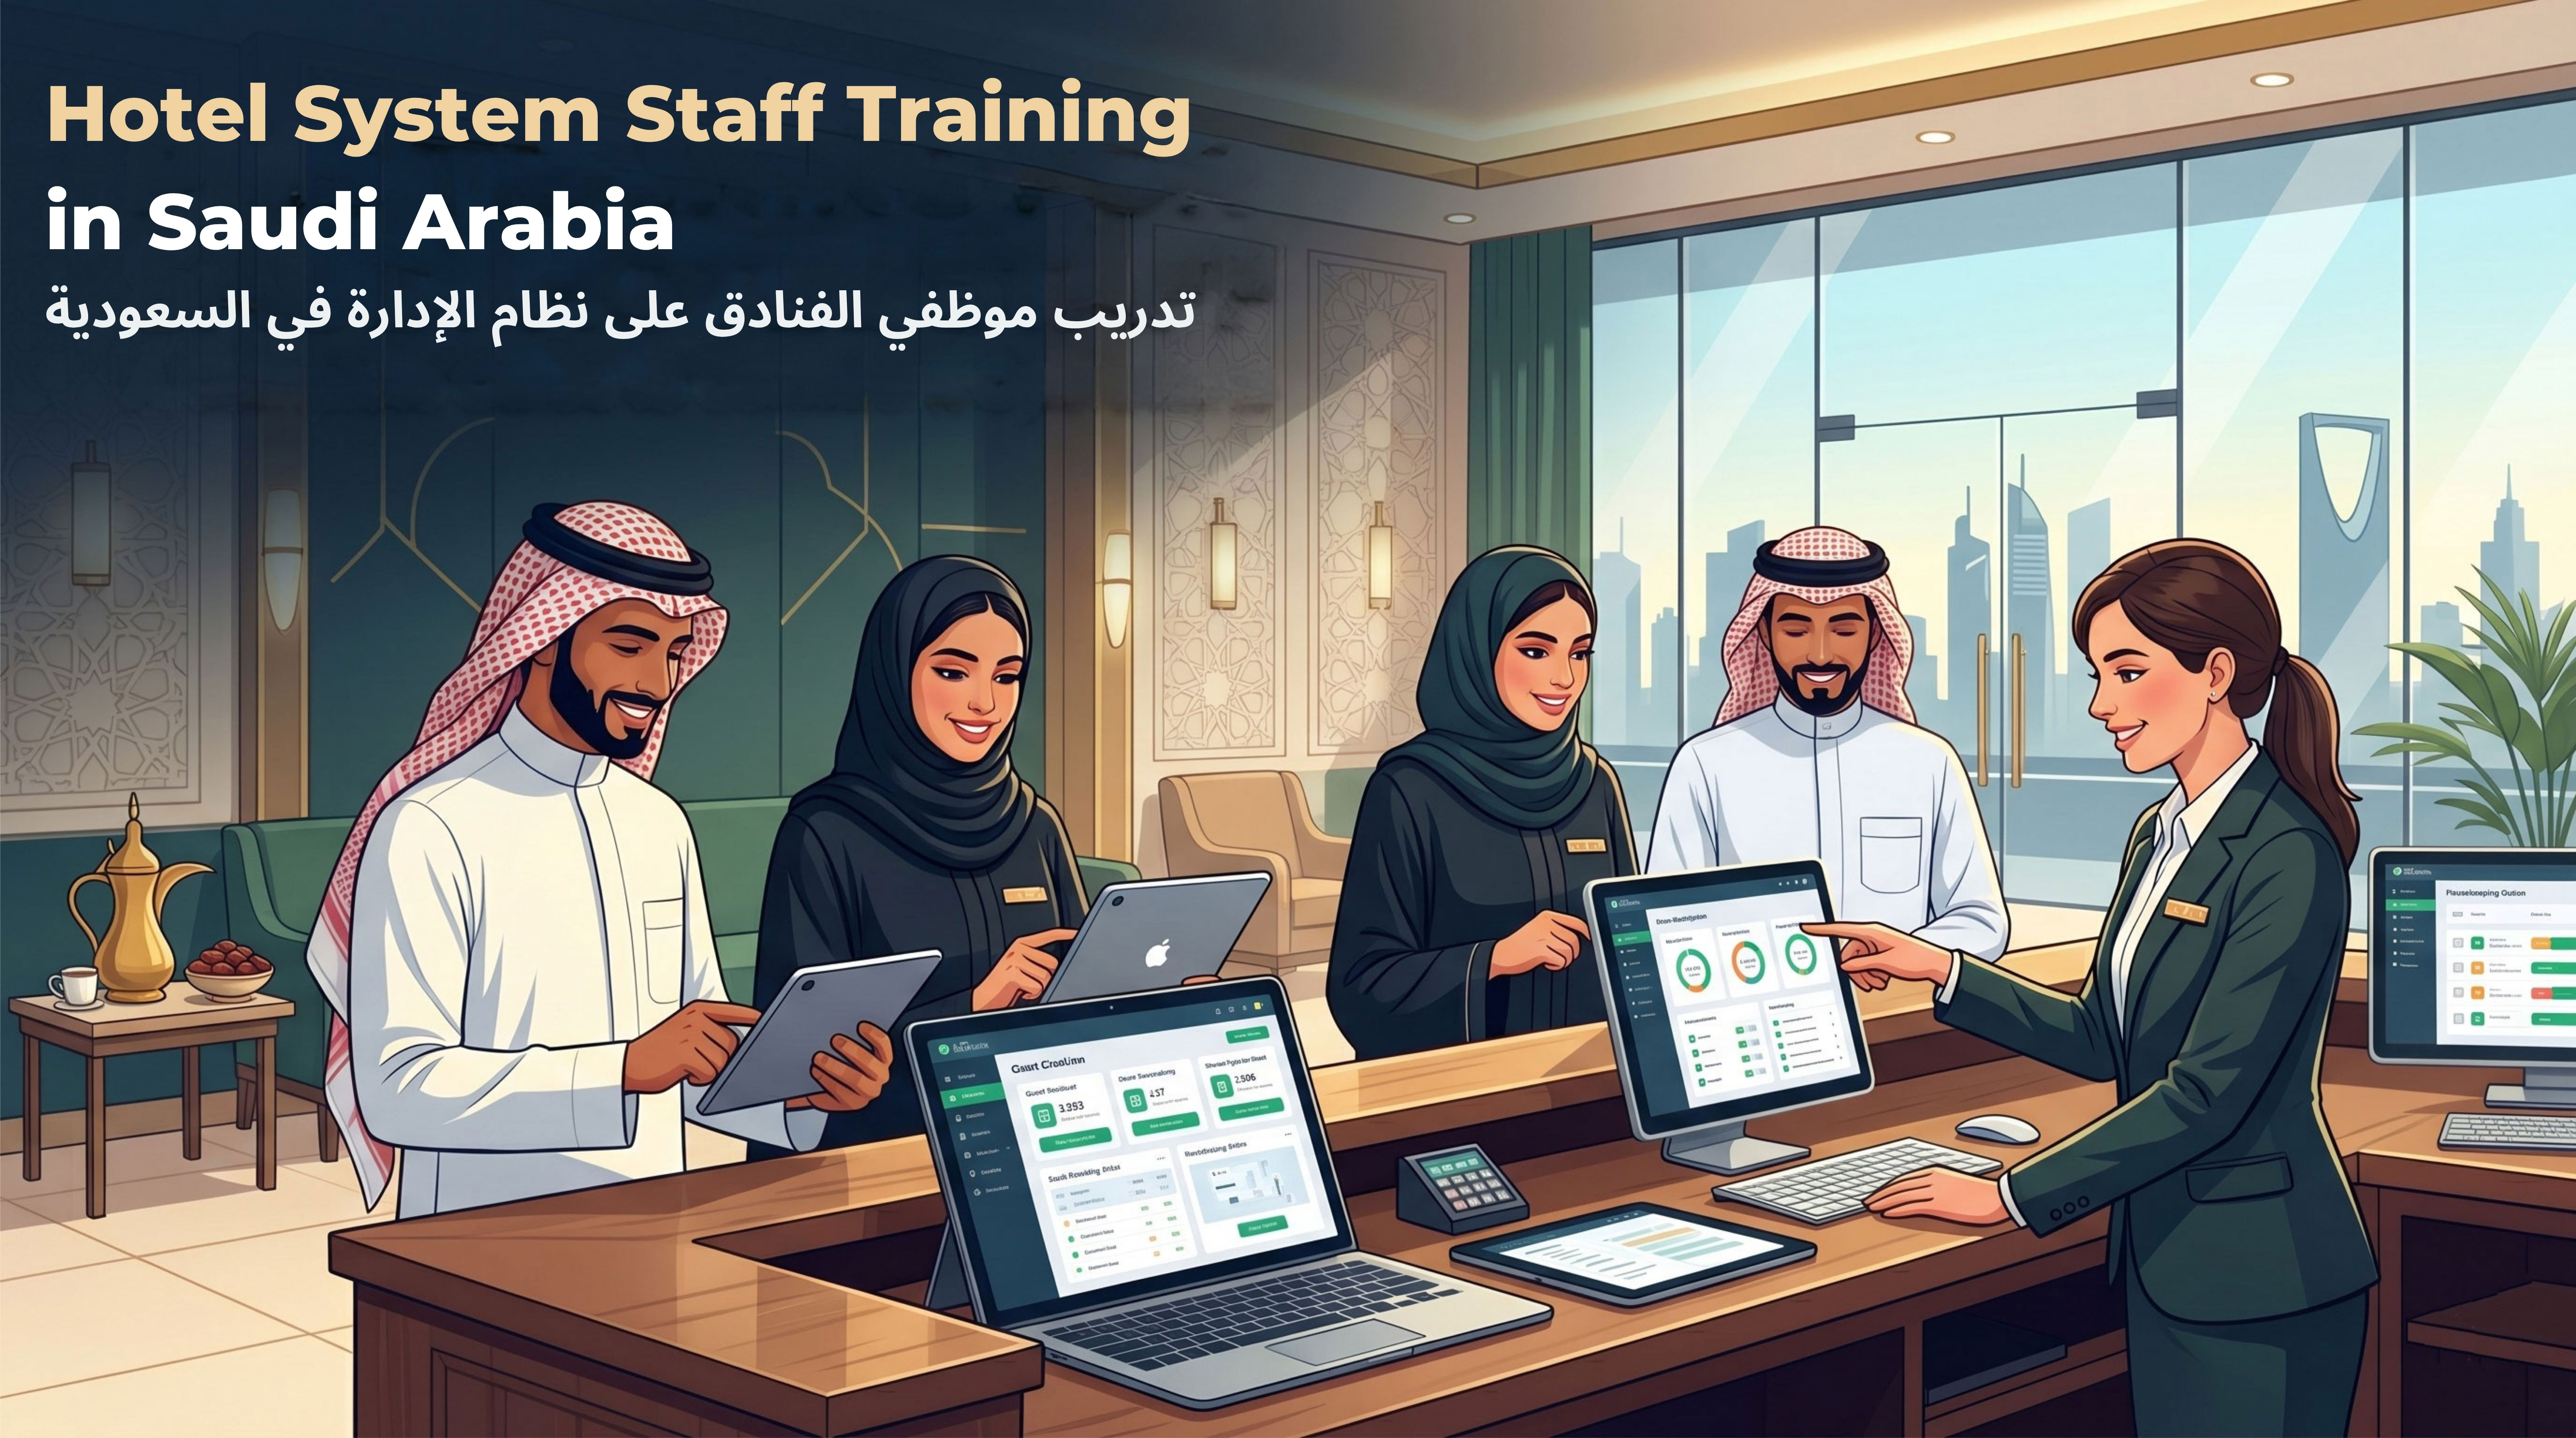
Complete guide to PMS training for hotel staff in Saudi Arabia. Learn how to train your team on ZATCA e‑invoicing, Shomoos integration, passport scanning, and check‑in automation. Free demo from F...
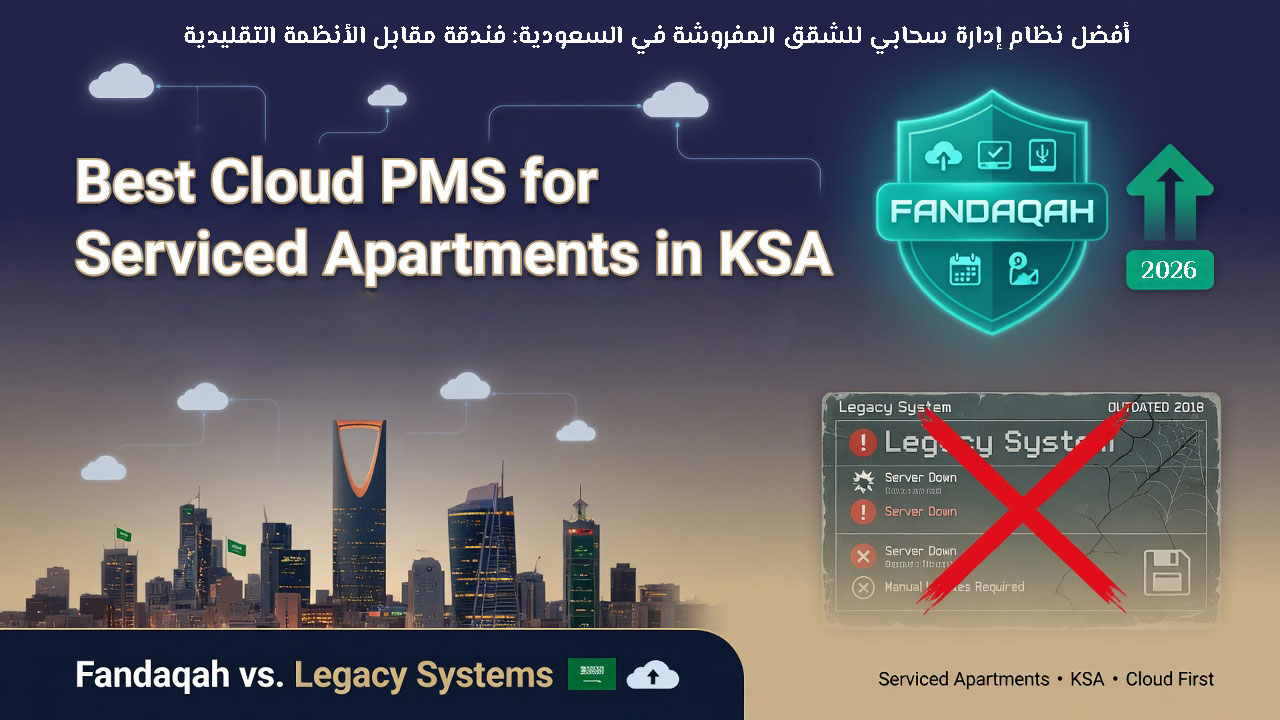
Compare the best cloud PMS for serviced apartments in KSA: Fandaqah vs. legacy systems. Discover automation, ZATCA & Shomoos compliance, and why modern cloud PMS wins. Free demo...
Saudi Arabia’s hospitality sector is experiencing unprecedented growth, driven by Vision 2030. Success now requires more than just a prime location—it demands the smart use of hotel management too...
As part of Saudi Arabia’s digital transformation, e-invoicing has become a cornerstone in regulating the relationship between businesses and the Zakat, Tax and Customs Authority (ZATCA). With the ro...

Discover the Kingdom’s transformation through Vision 2030, where ancient spirituality meets modern adventure tourism. The Future of Hospitality Summit is driving regional change. Explore spiritual j...
Property management software Saudi Arabia by Fandaqah: ZATCA & Shomoos compliant, passport scanner, 85% faster check-in. Trusted by 850+ hotels. Demo now....
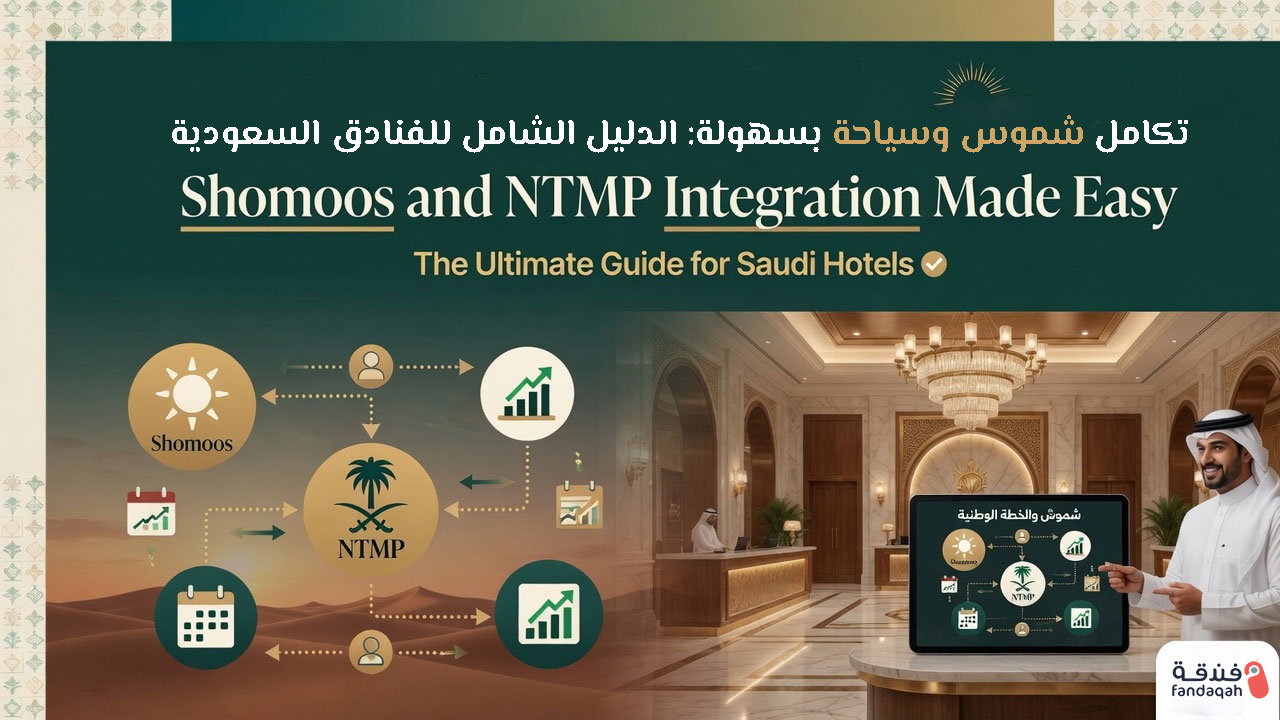
Complete guide to Shomoos and Siyaha integration for Saudi hotels. Learn how to automate guest registration, avoid fines, and streamline operations with a modern hotel PMS. Free demo from Fandaqah...
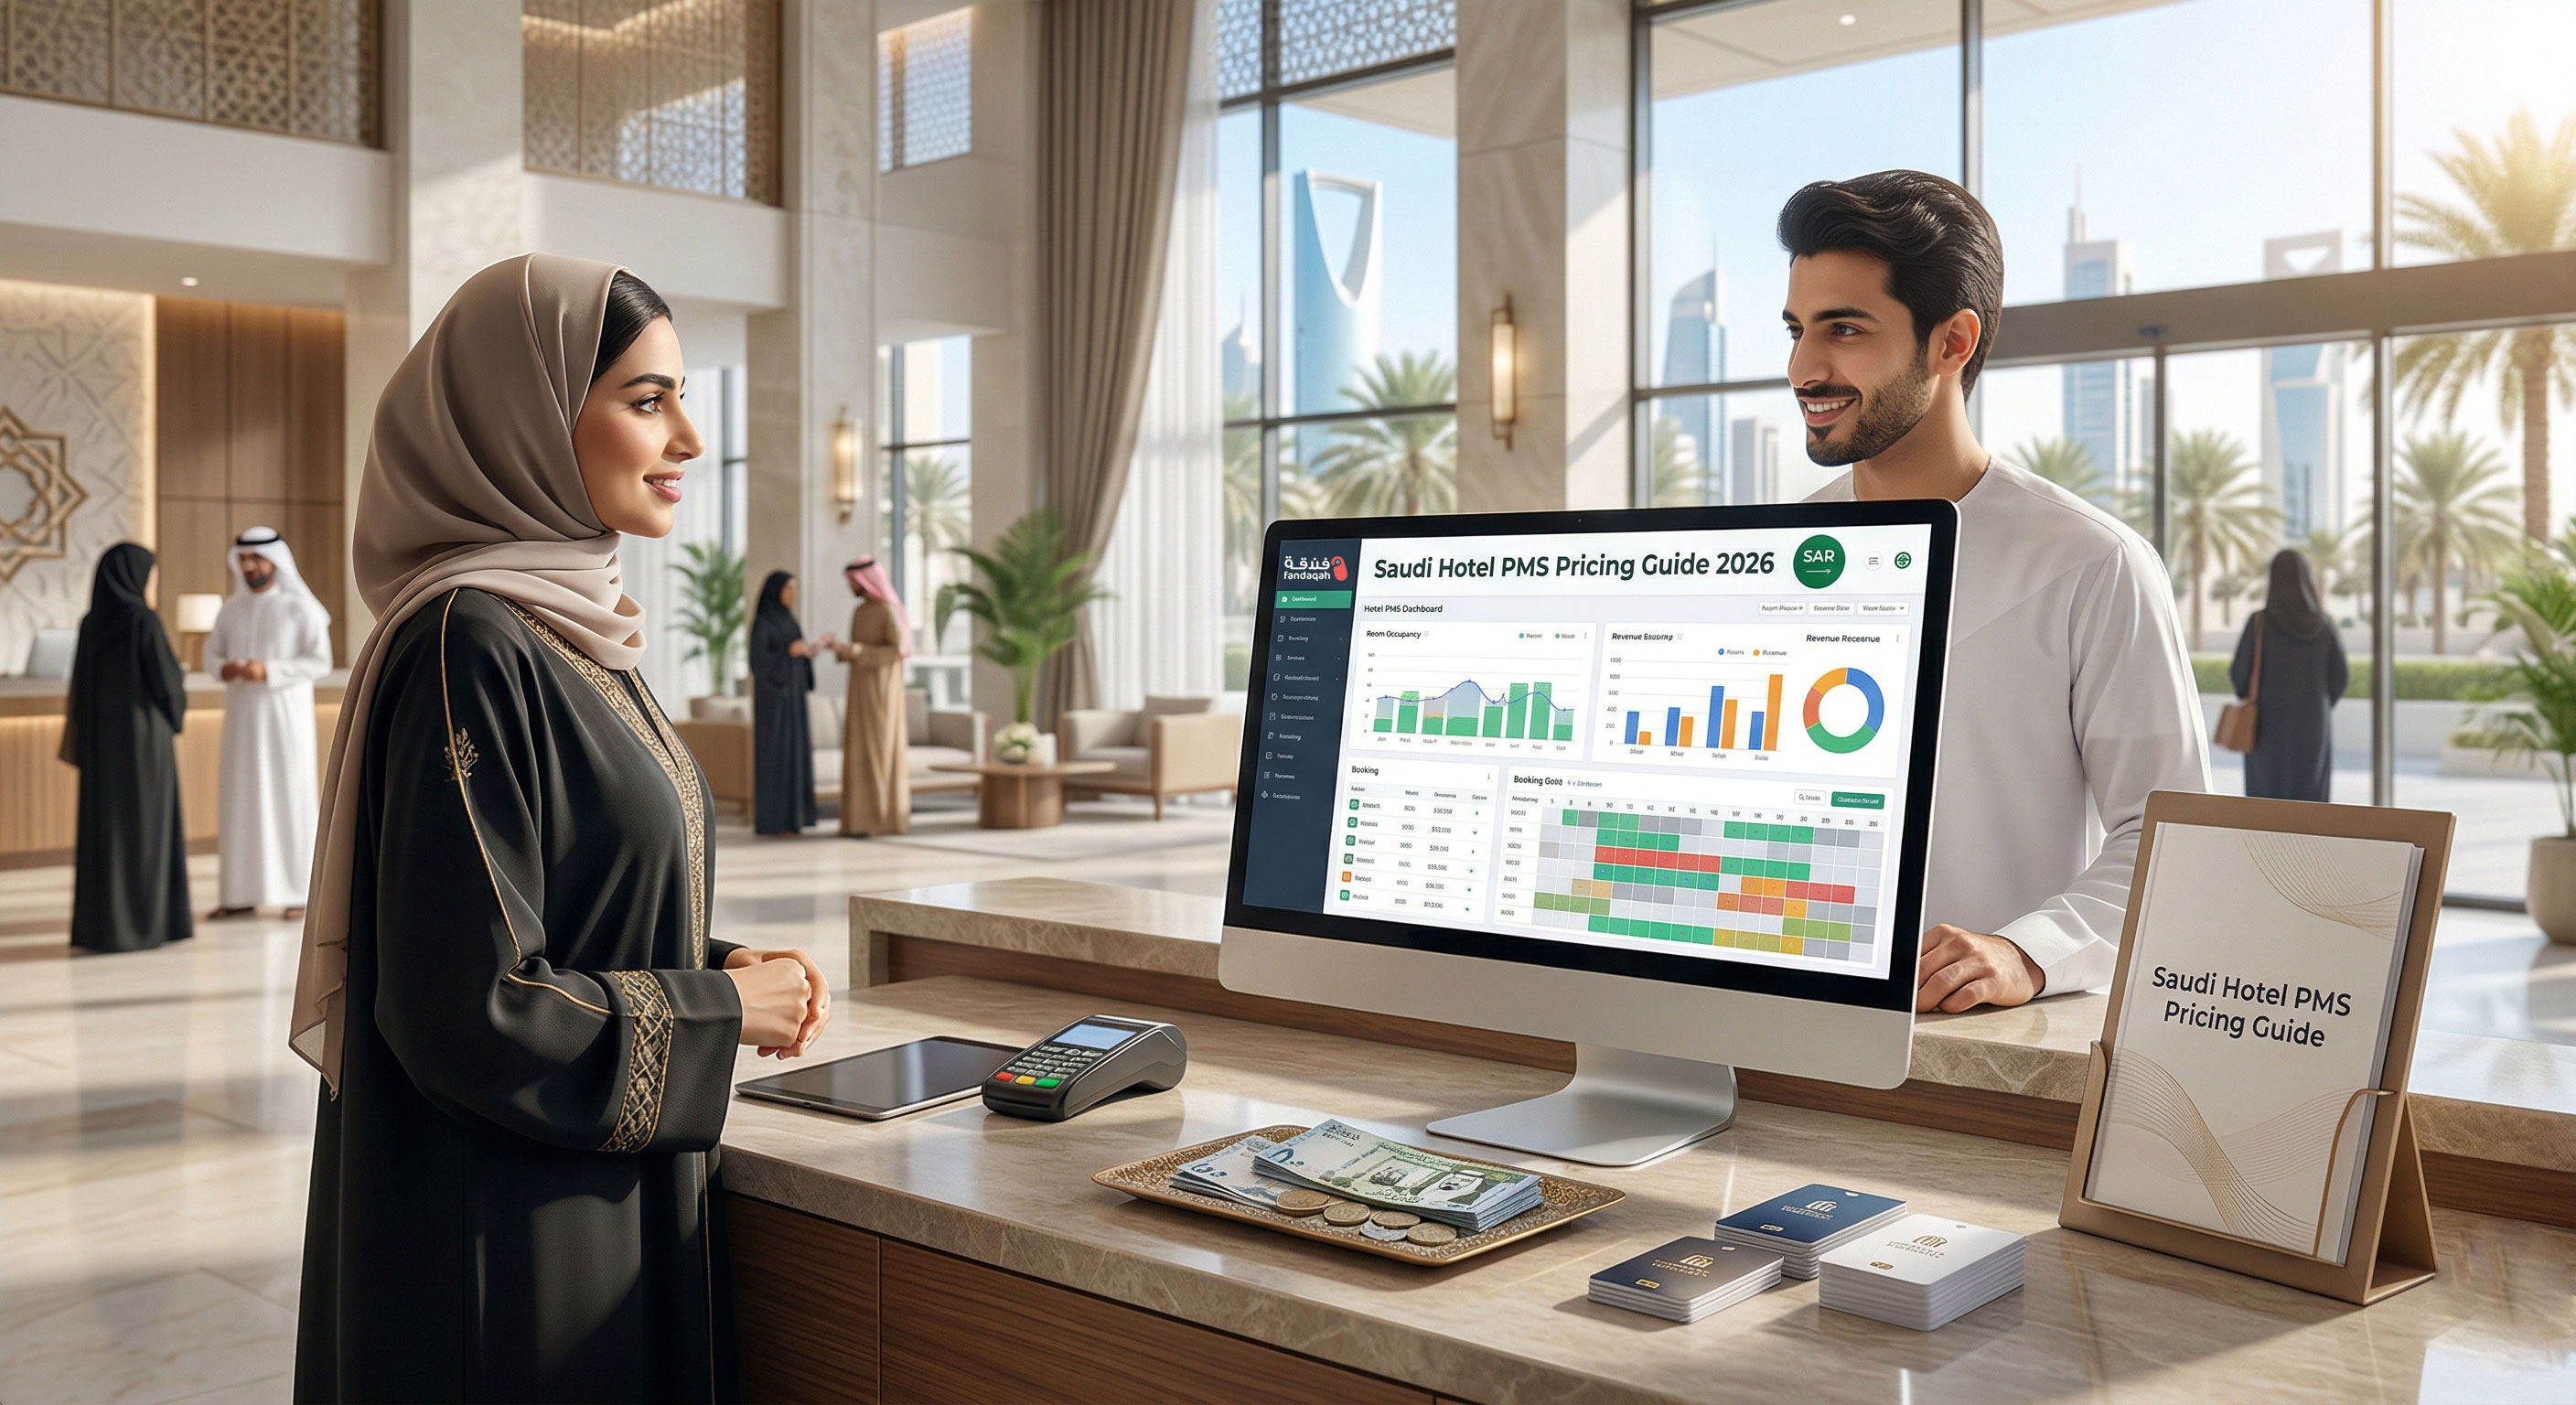
Complete guide to hotel PMS cost in Saudi Arabia. Understand pricing models, hidden fees, ZATCA & Shomoos compliance costs, and how to choose the right hotel management system KSA for your budget...
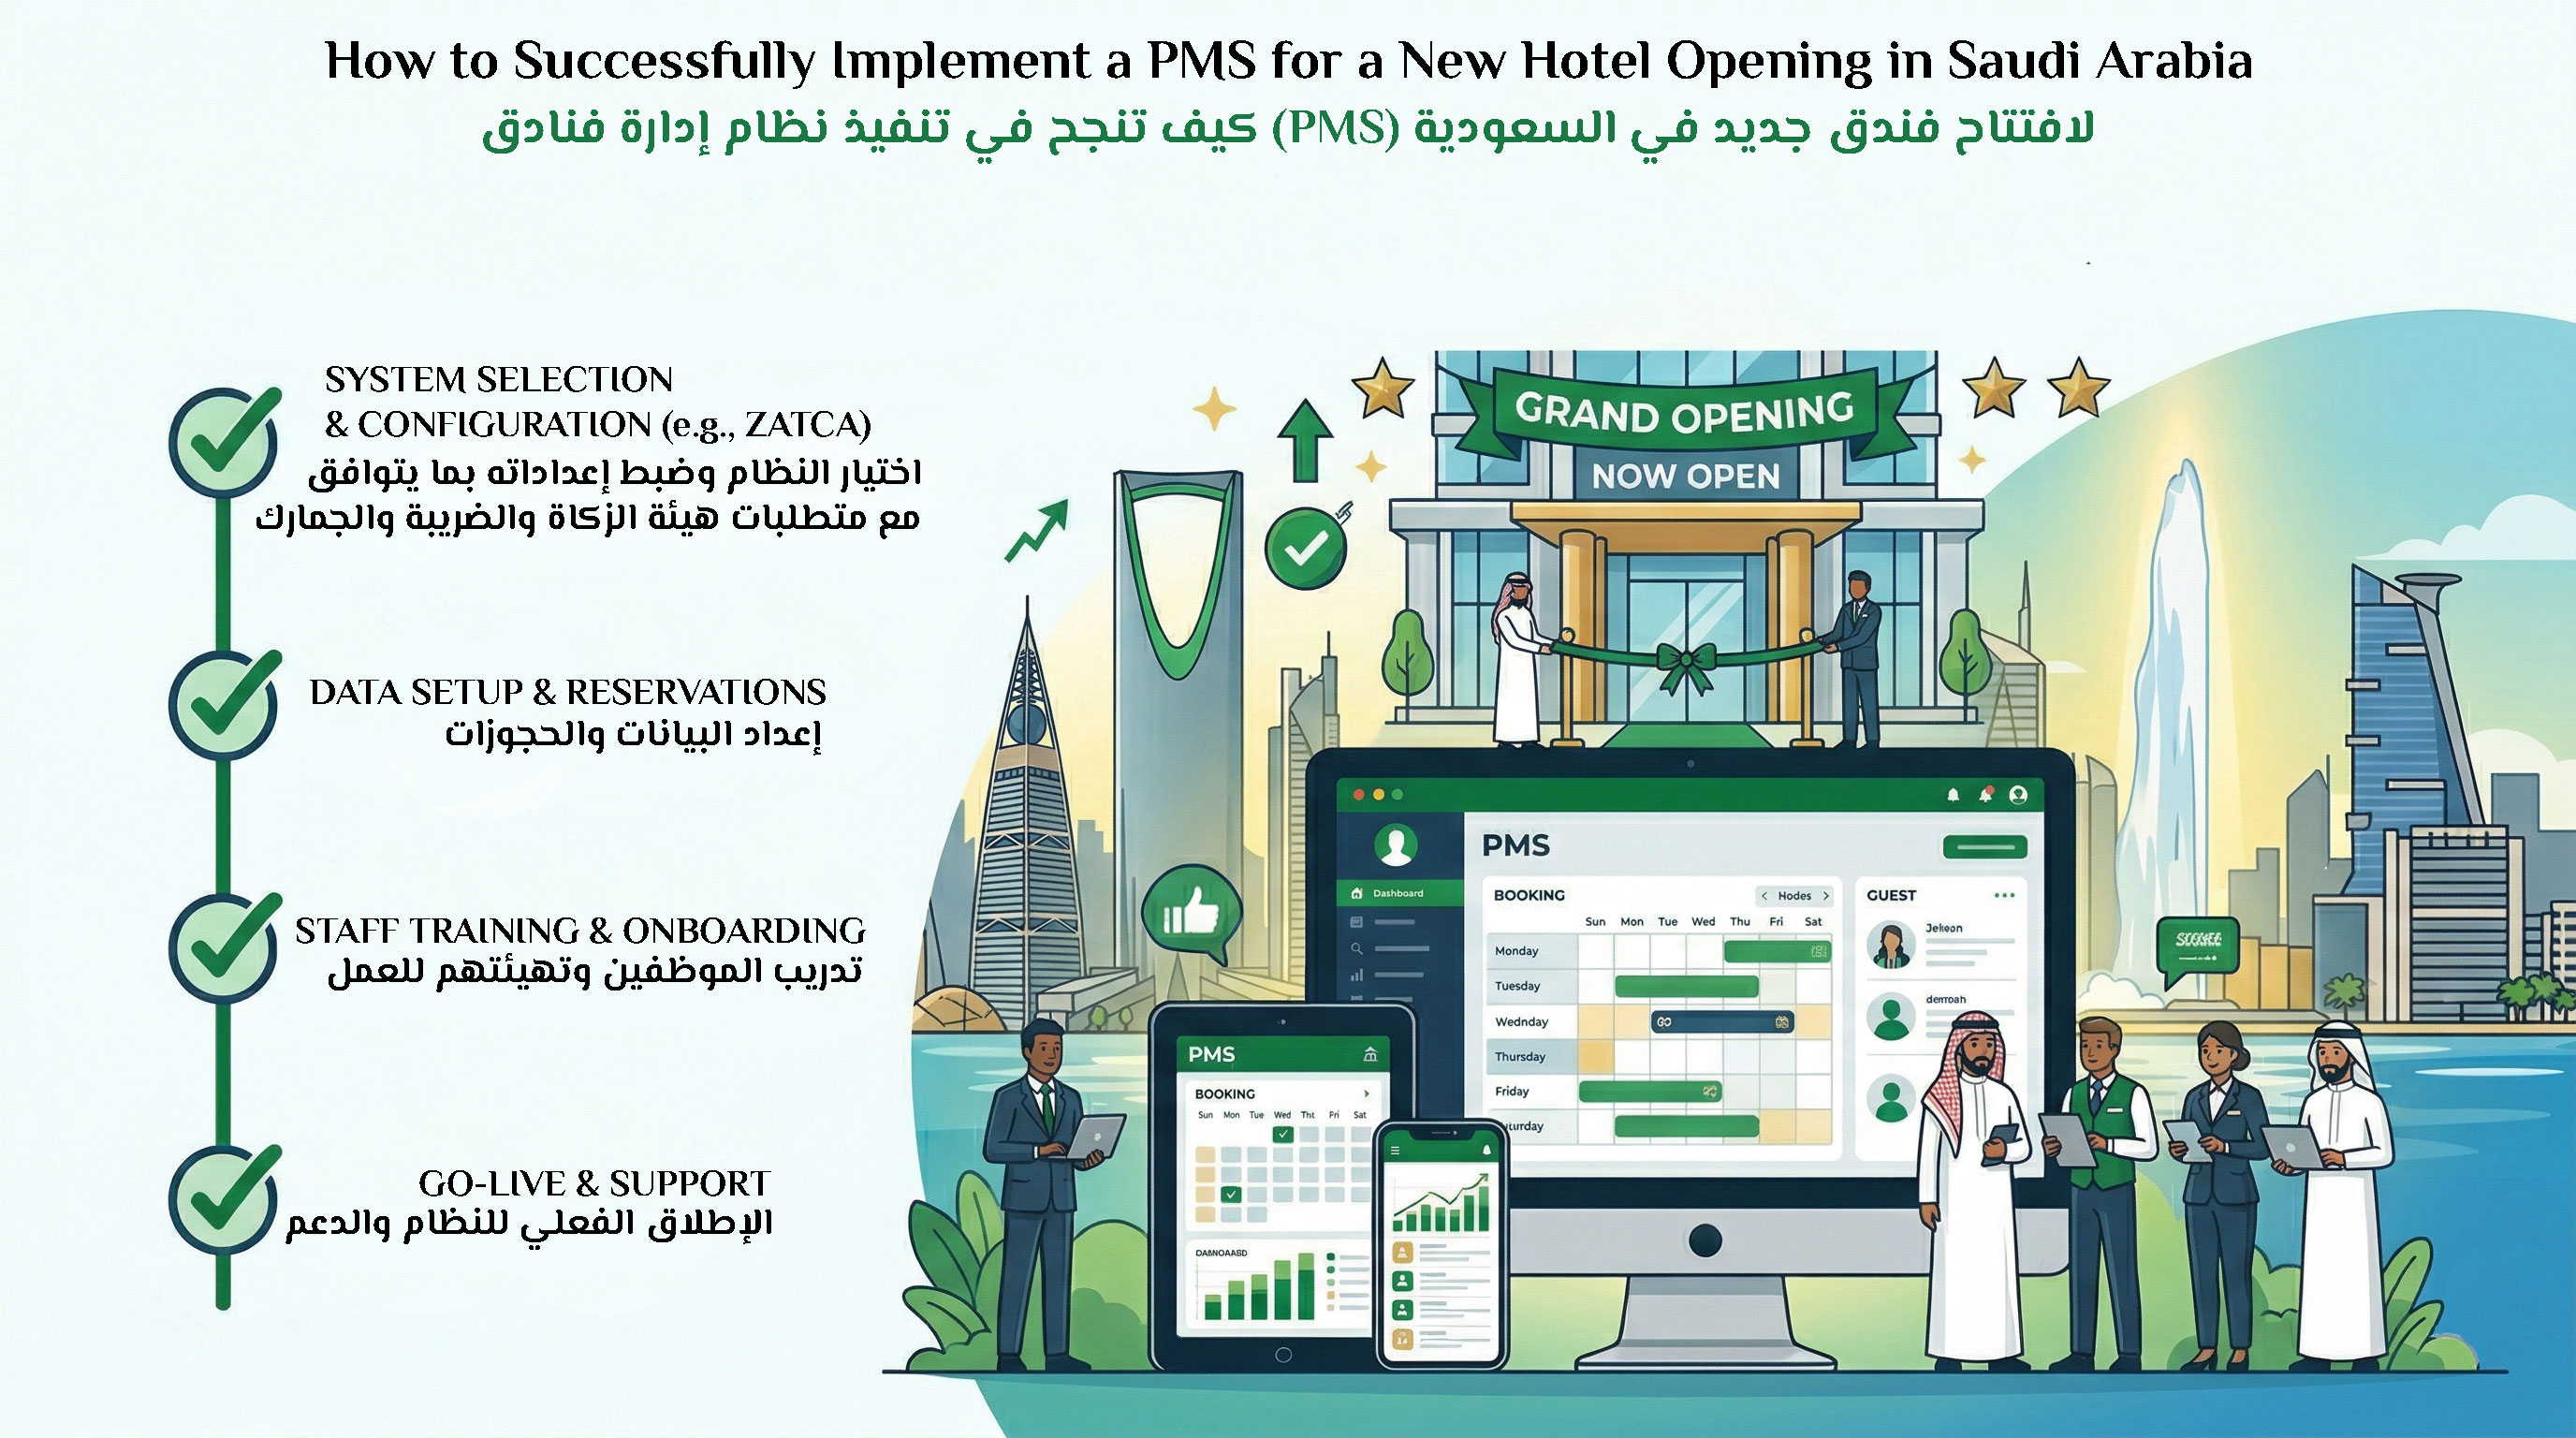
Step‑by‑step guide to implementing a PMS for a new hotel opening in Saudi Arabia. Covering ZATCA, Shomoos, check‑in automation, and best practices for a successful launch. Free demo from Fandaqa...

Discover why a local PMS vendor in Riyadh or Jeddah is the smart choice for your hotel. Faster support, ZATCA & Shomoos compliance, Arabic interface, and data residency. Free demo from Fandaqah...
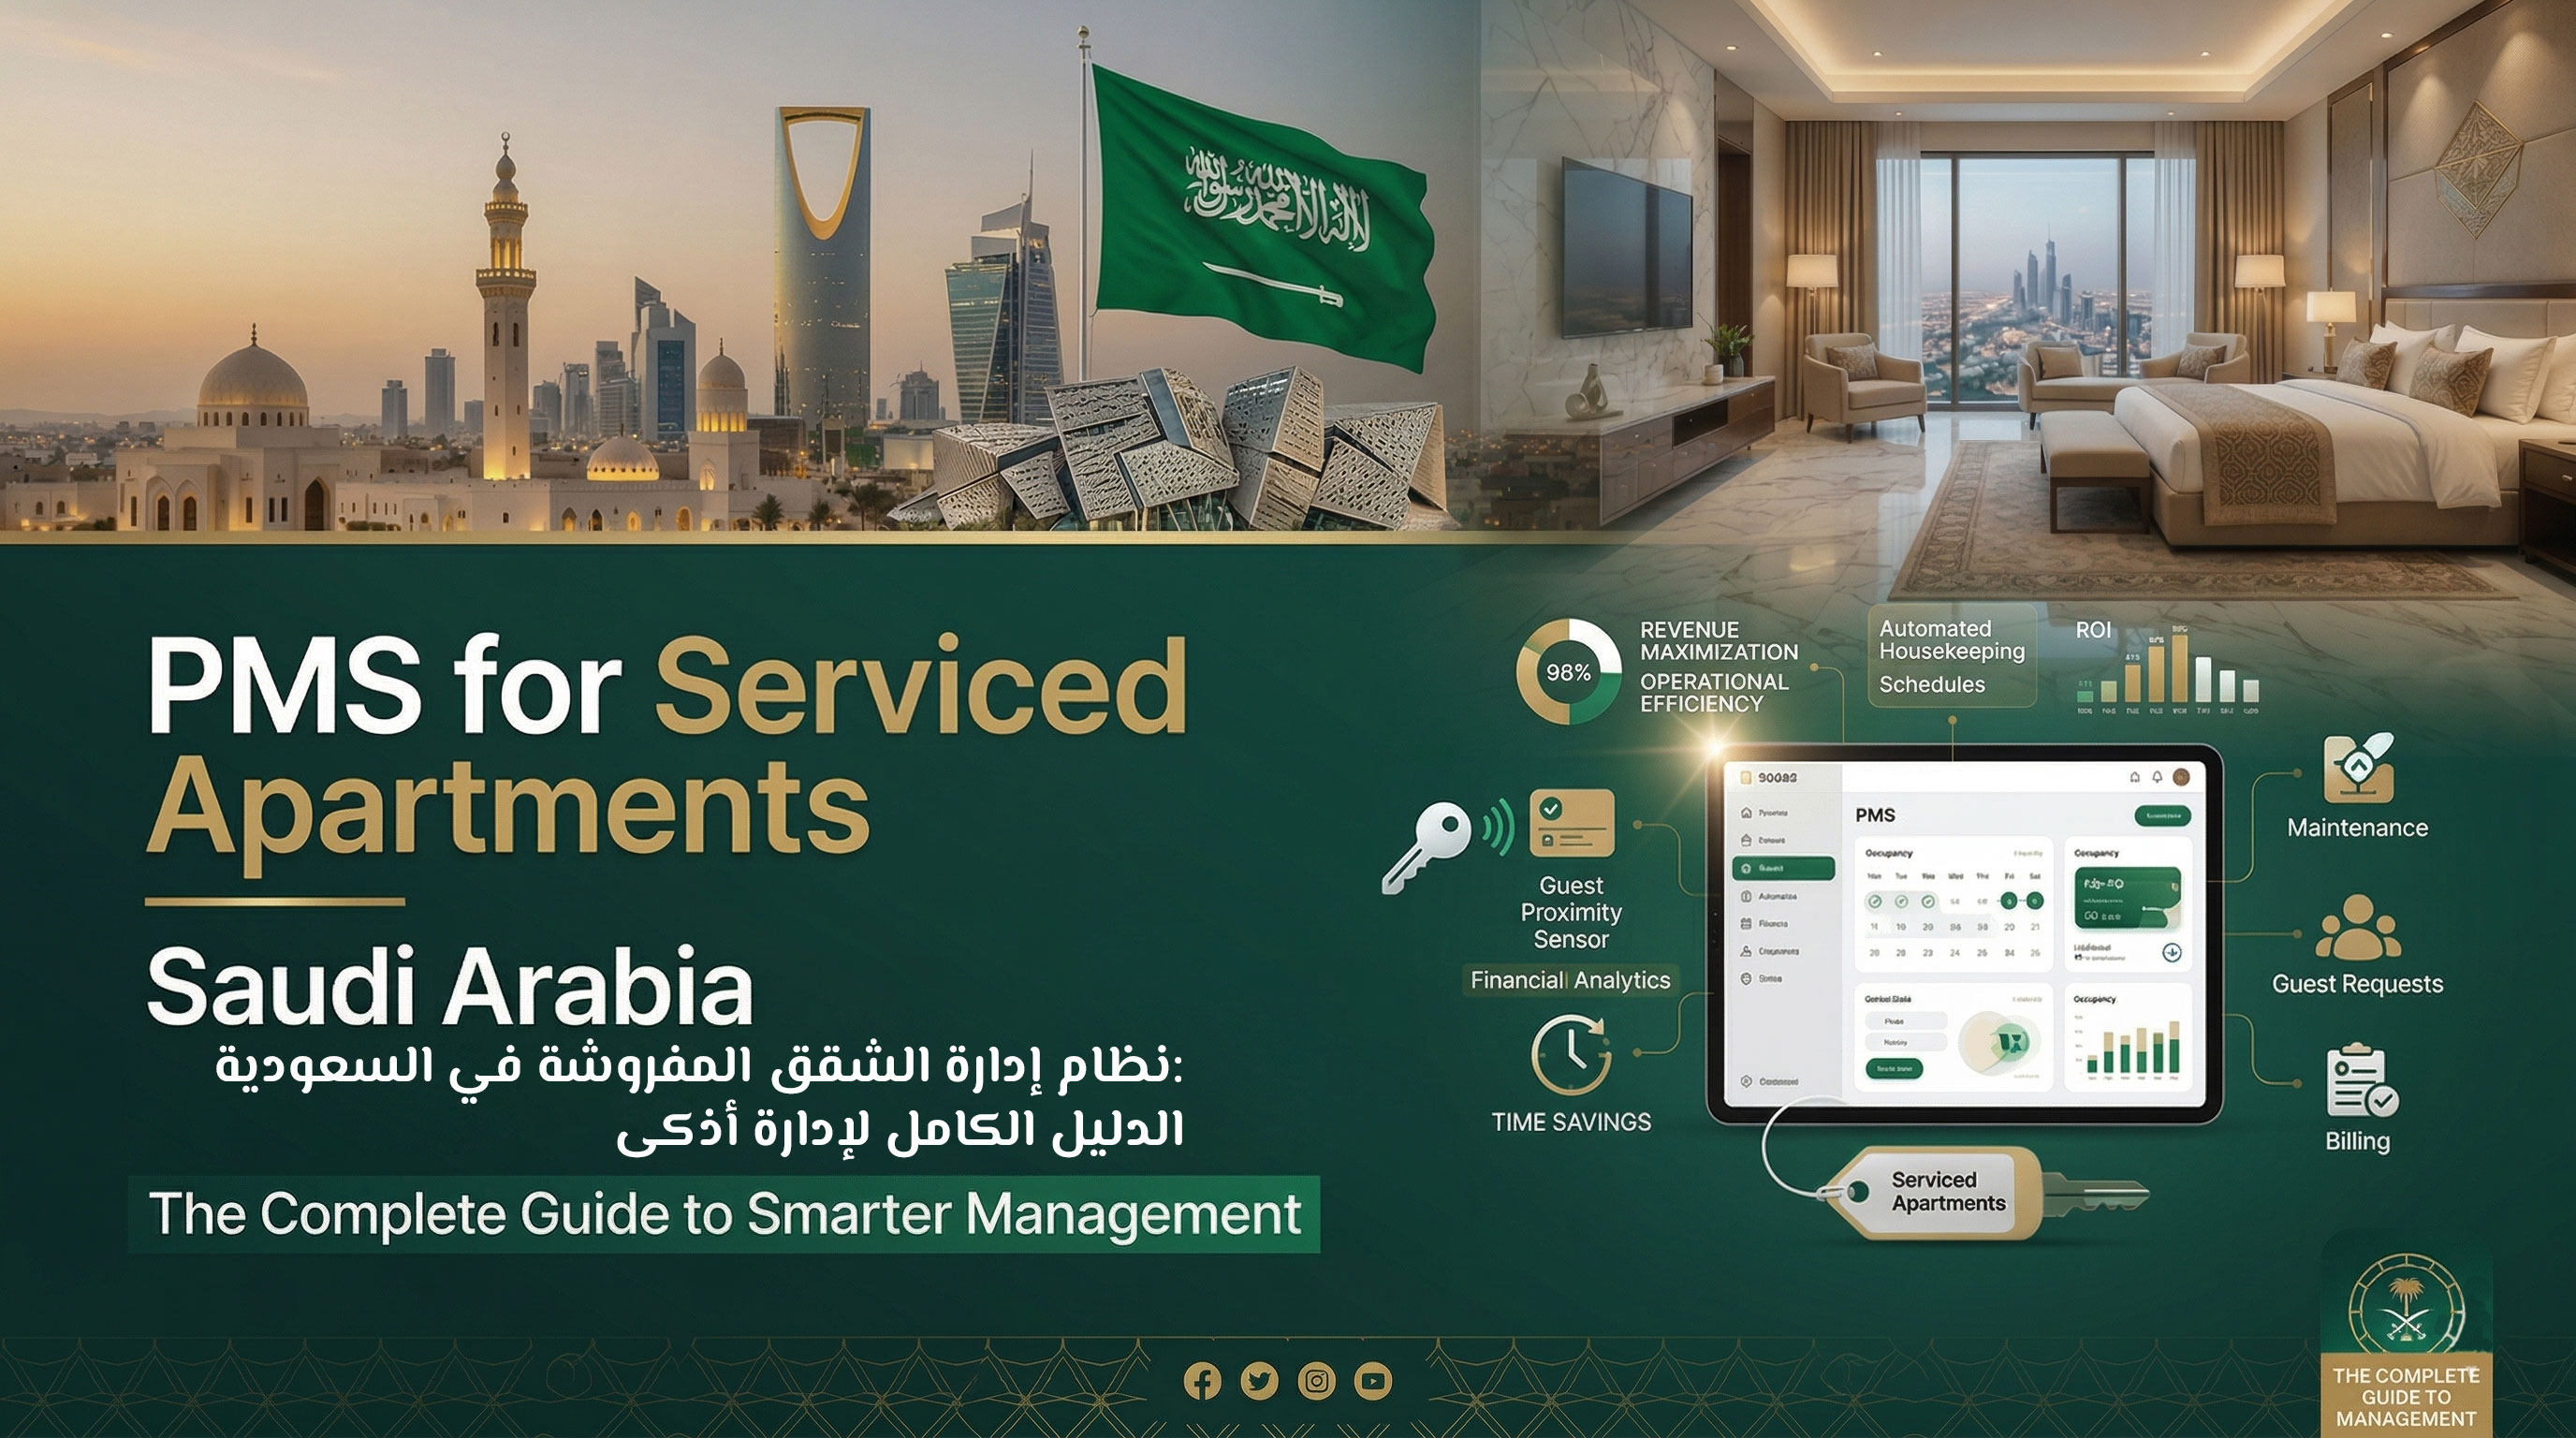
Discover the best PMS for serviced apartments in Saudi Arabia. Automate check-in, manage multiple units, ensure ZATCA & Shomoos compliance, and boost revenue. Free demo for property managers...
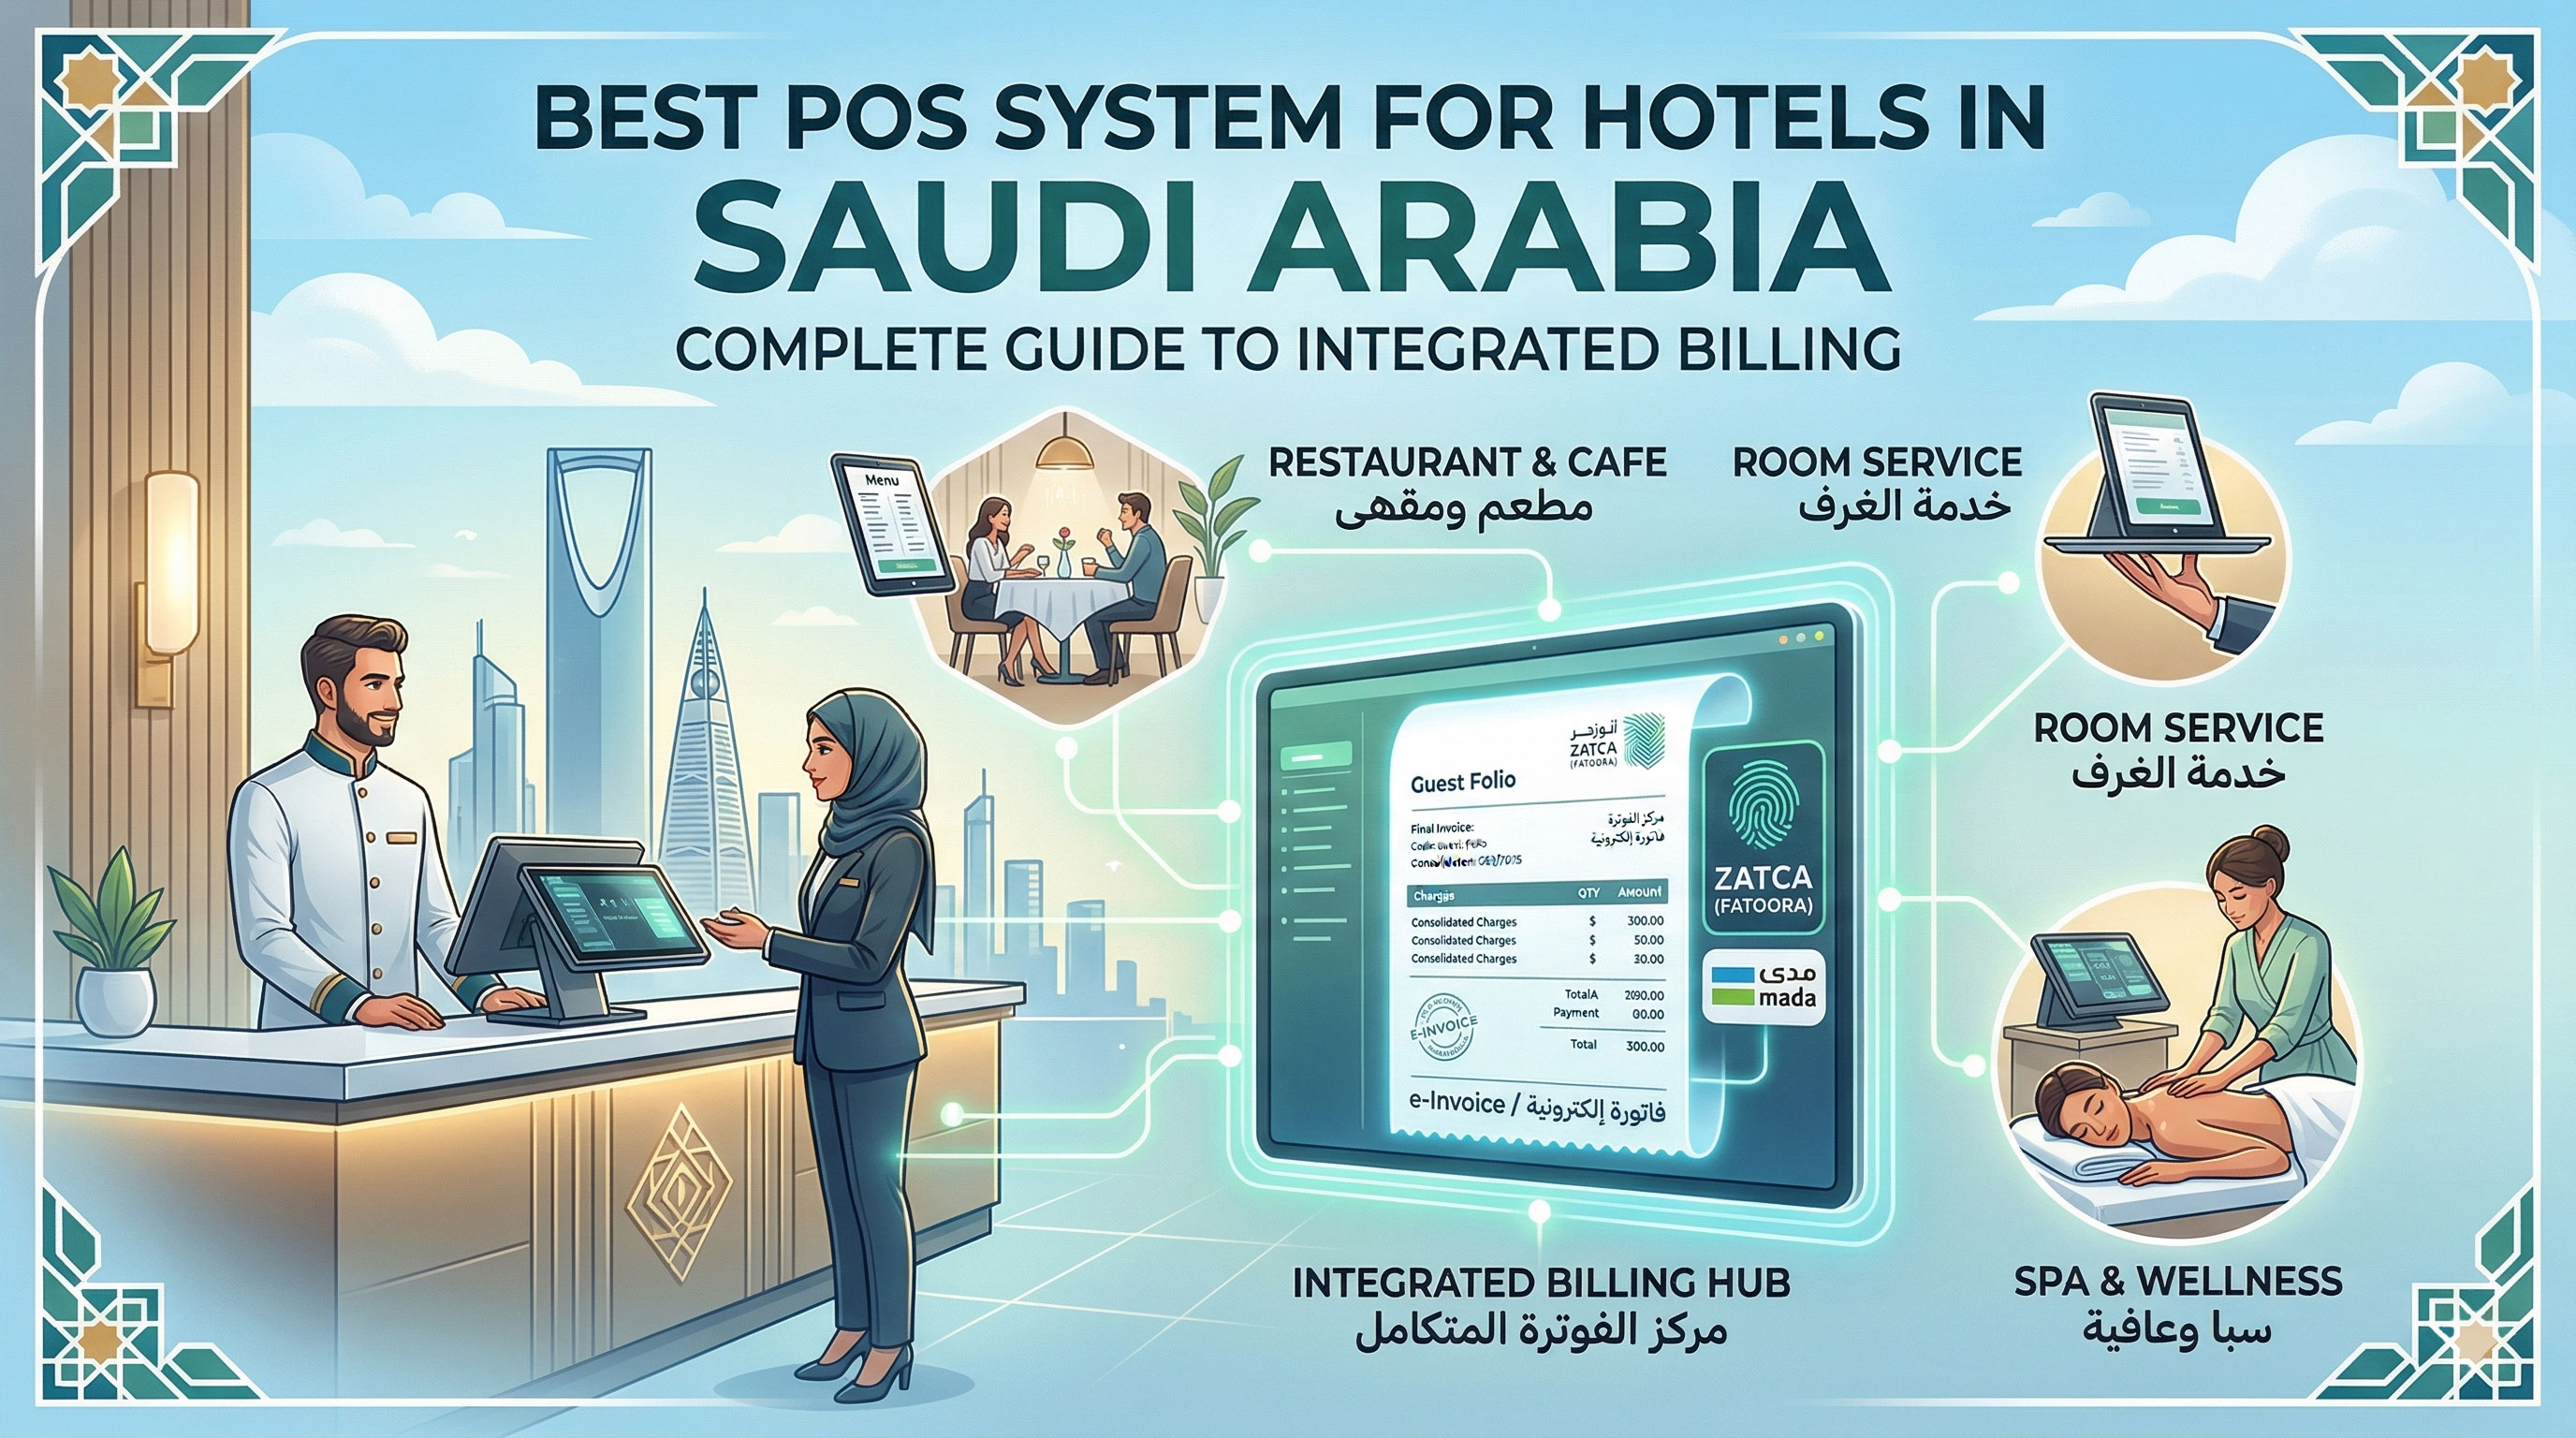
Discover the best POS system for hotels in Saudi Arabia. Integrate F&B, spa, and retail billing with your hotel PMS. ZATCA compliant, Shomoos ready. Free demo for hoteliers...
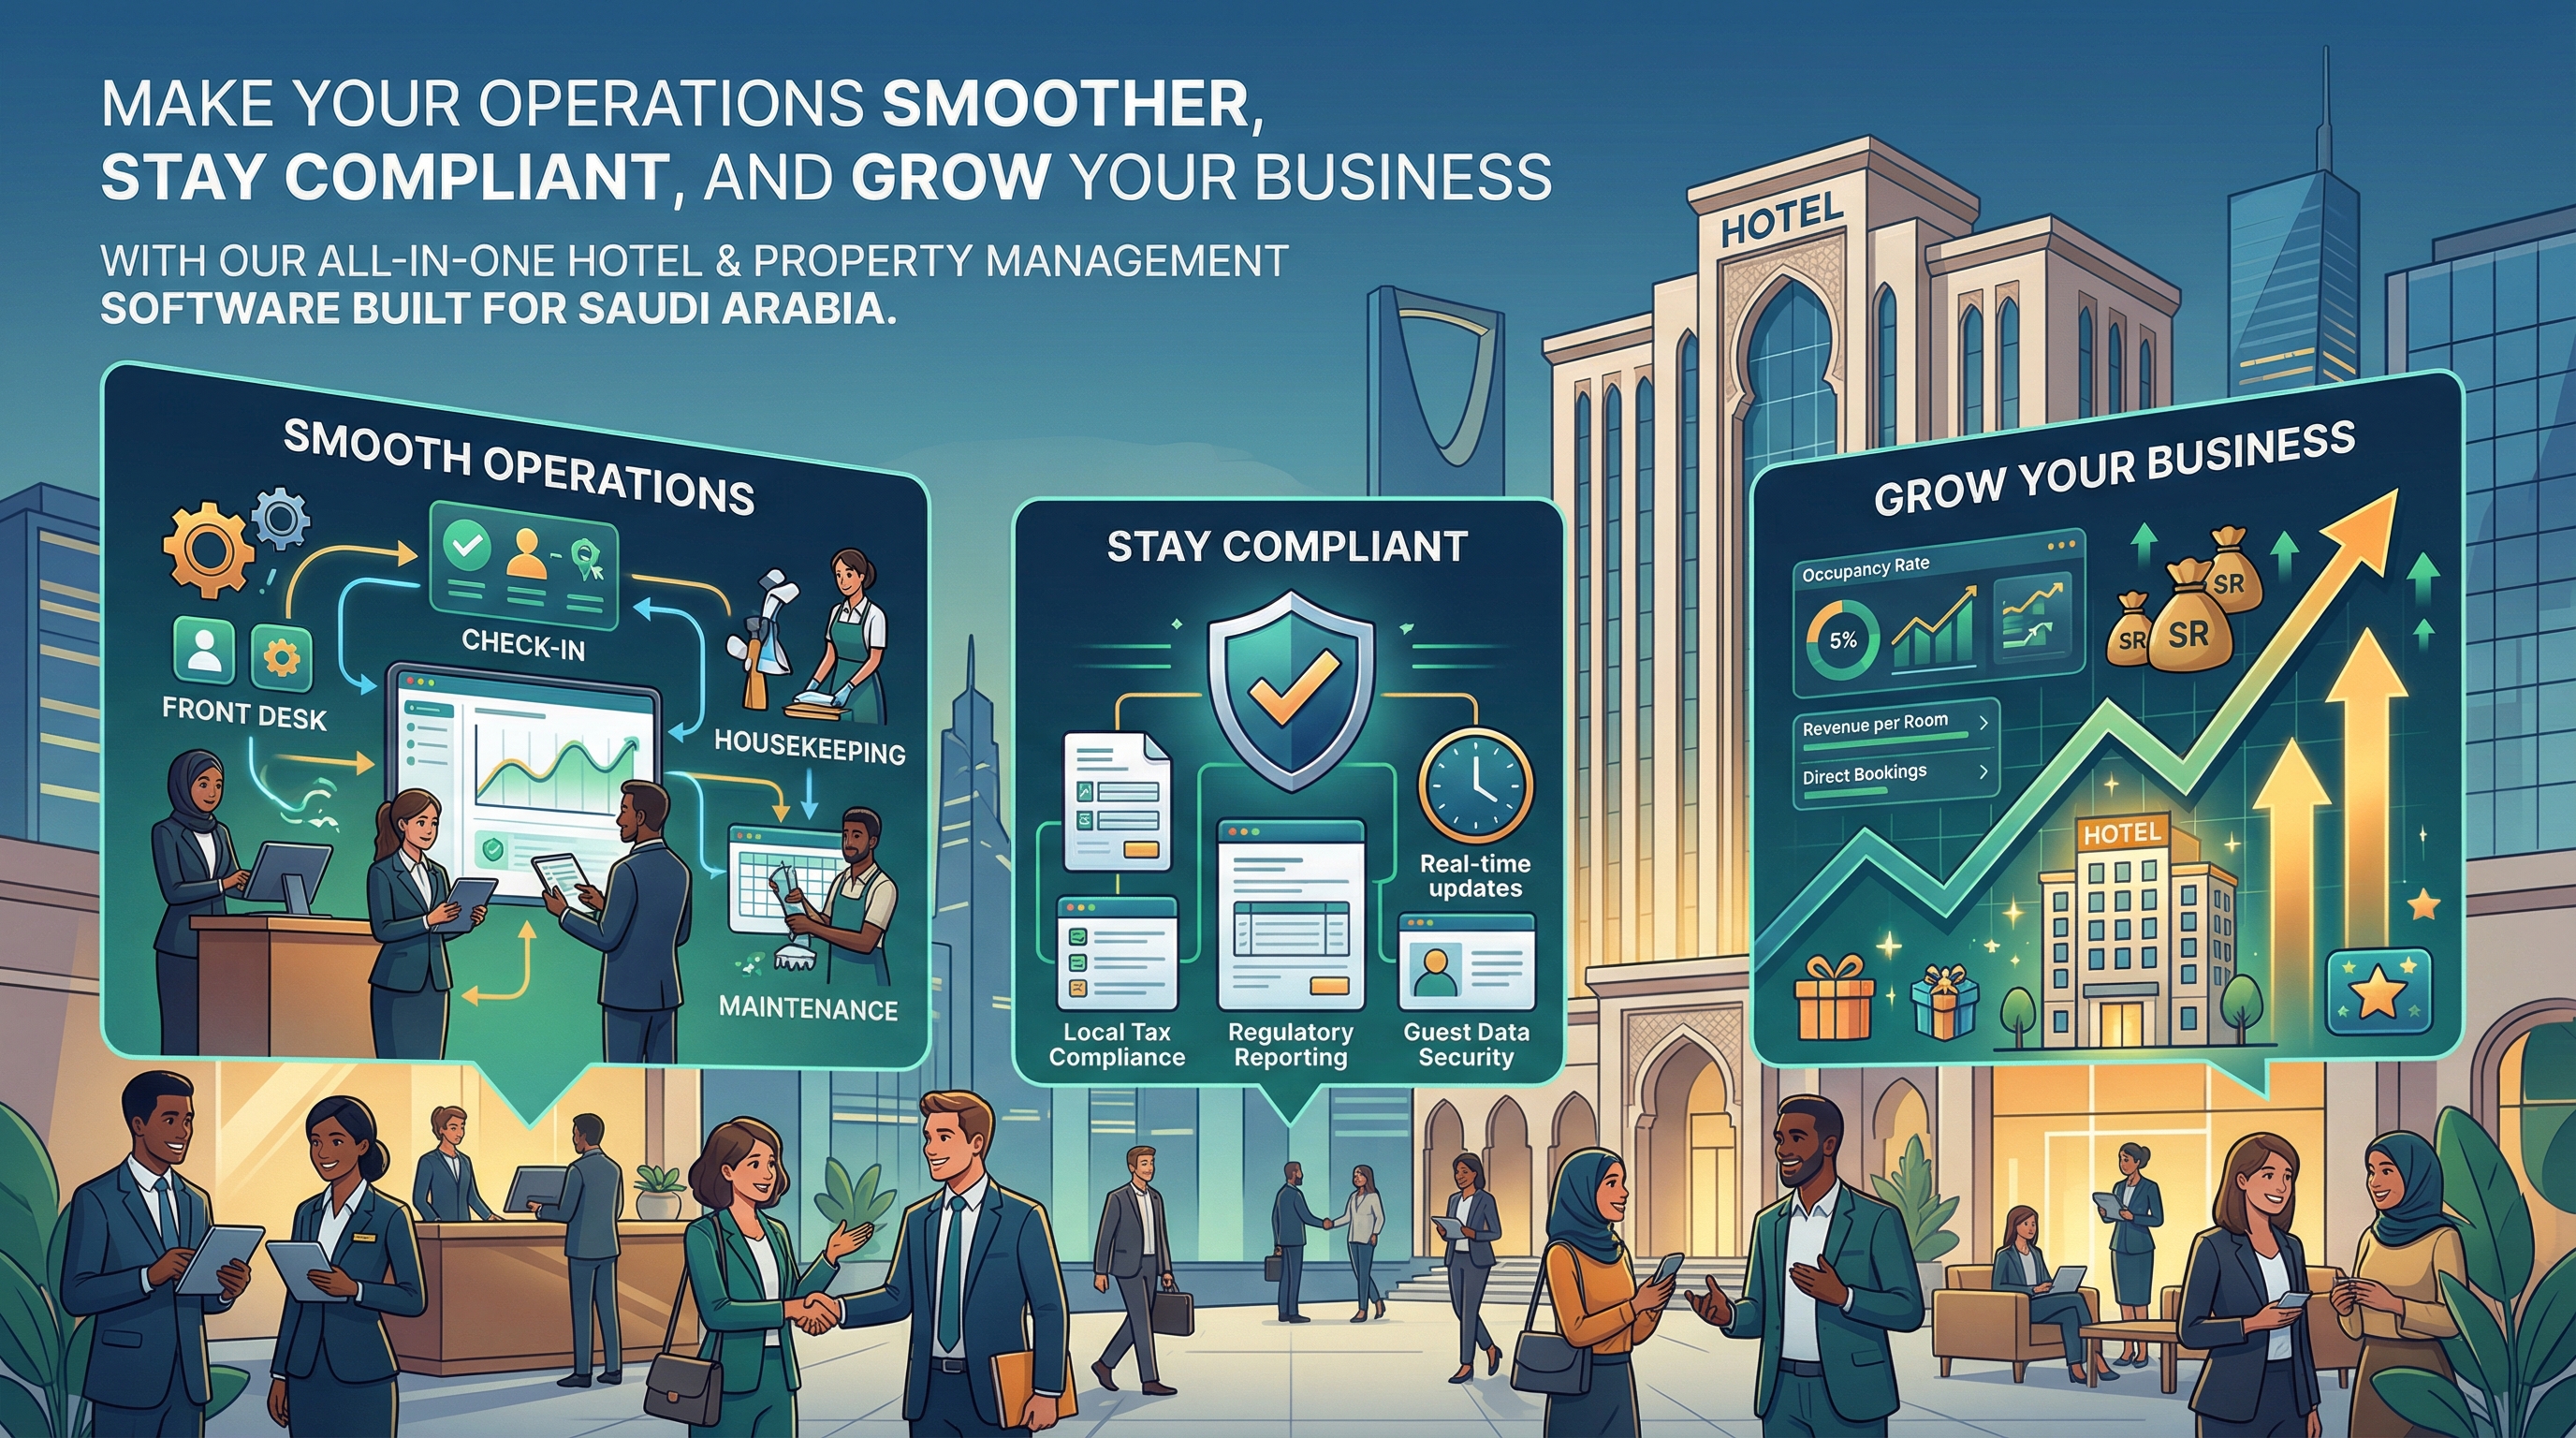
Fandaqah is Saudi Arabia's leading hotel management software. ZATCA, Shomoos & Ministry of Tourism compliant. PMS, booking engine & channel manager in one platform....
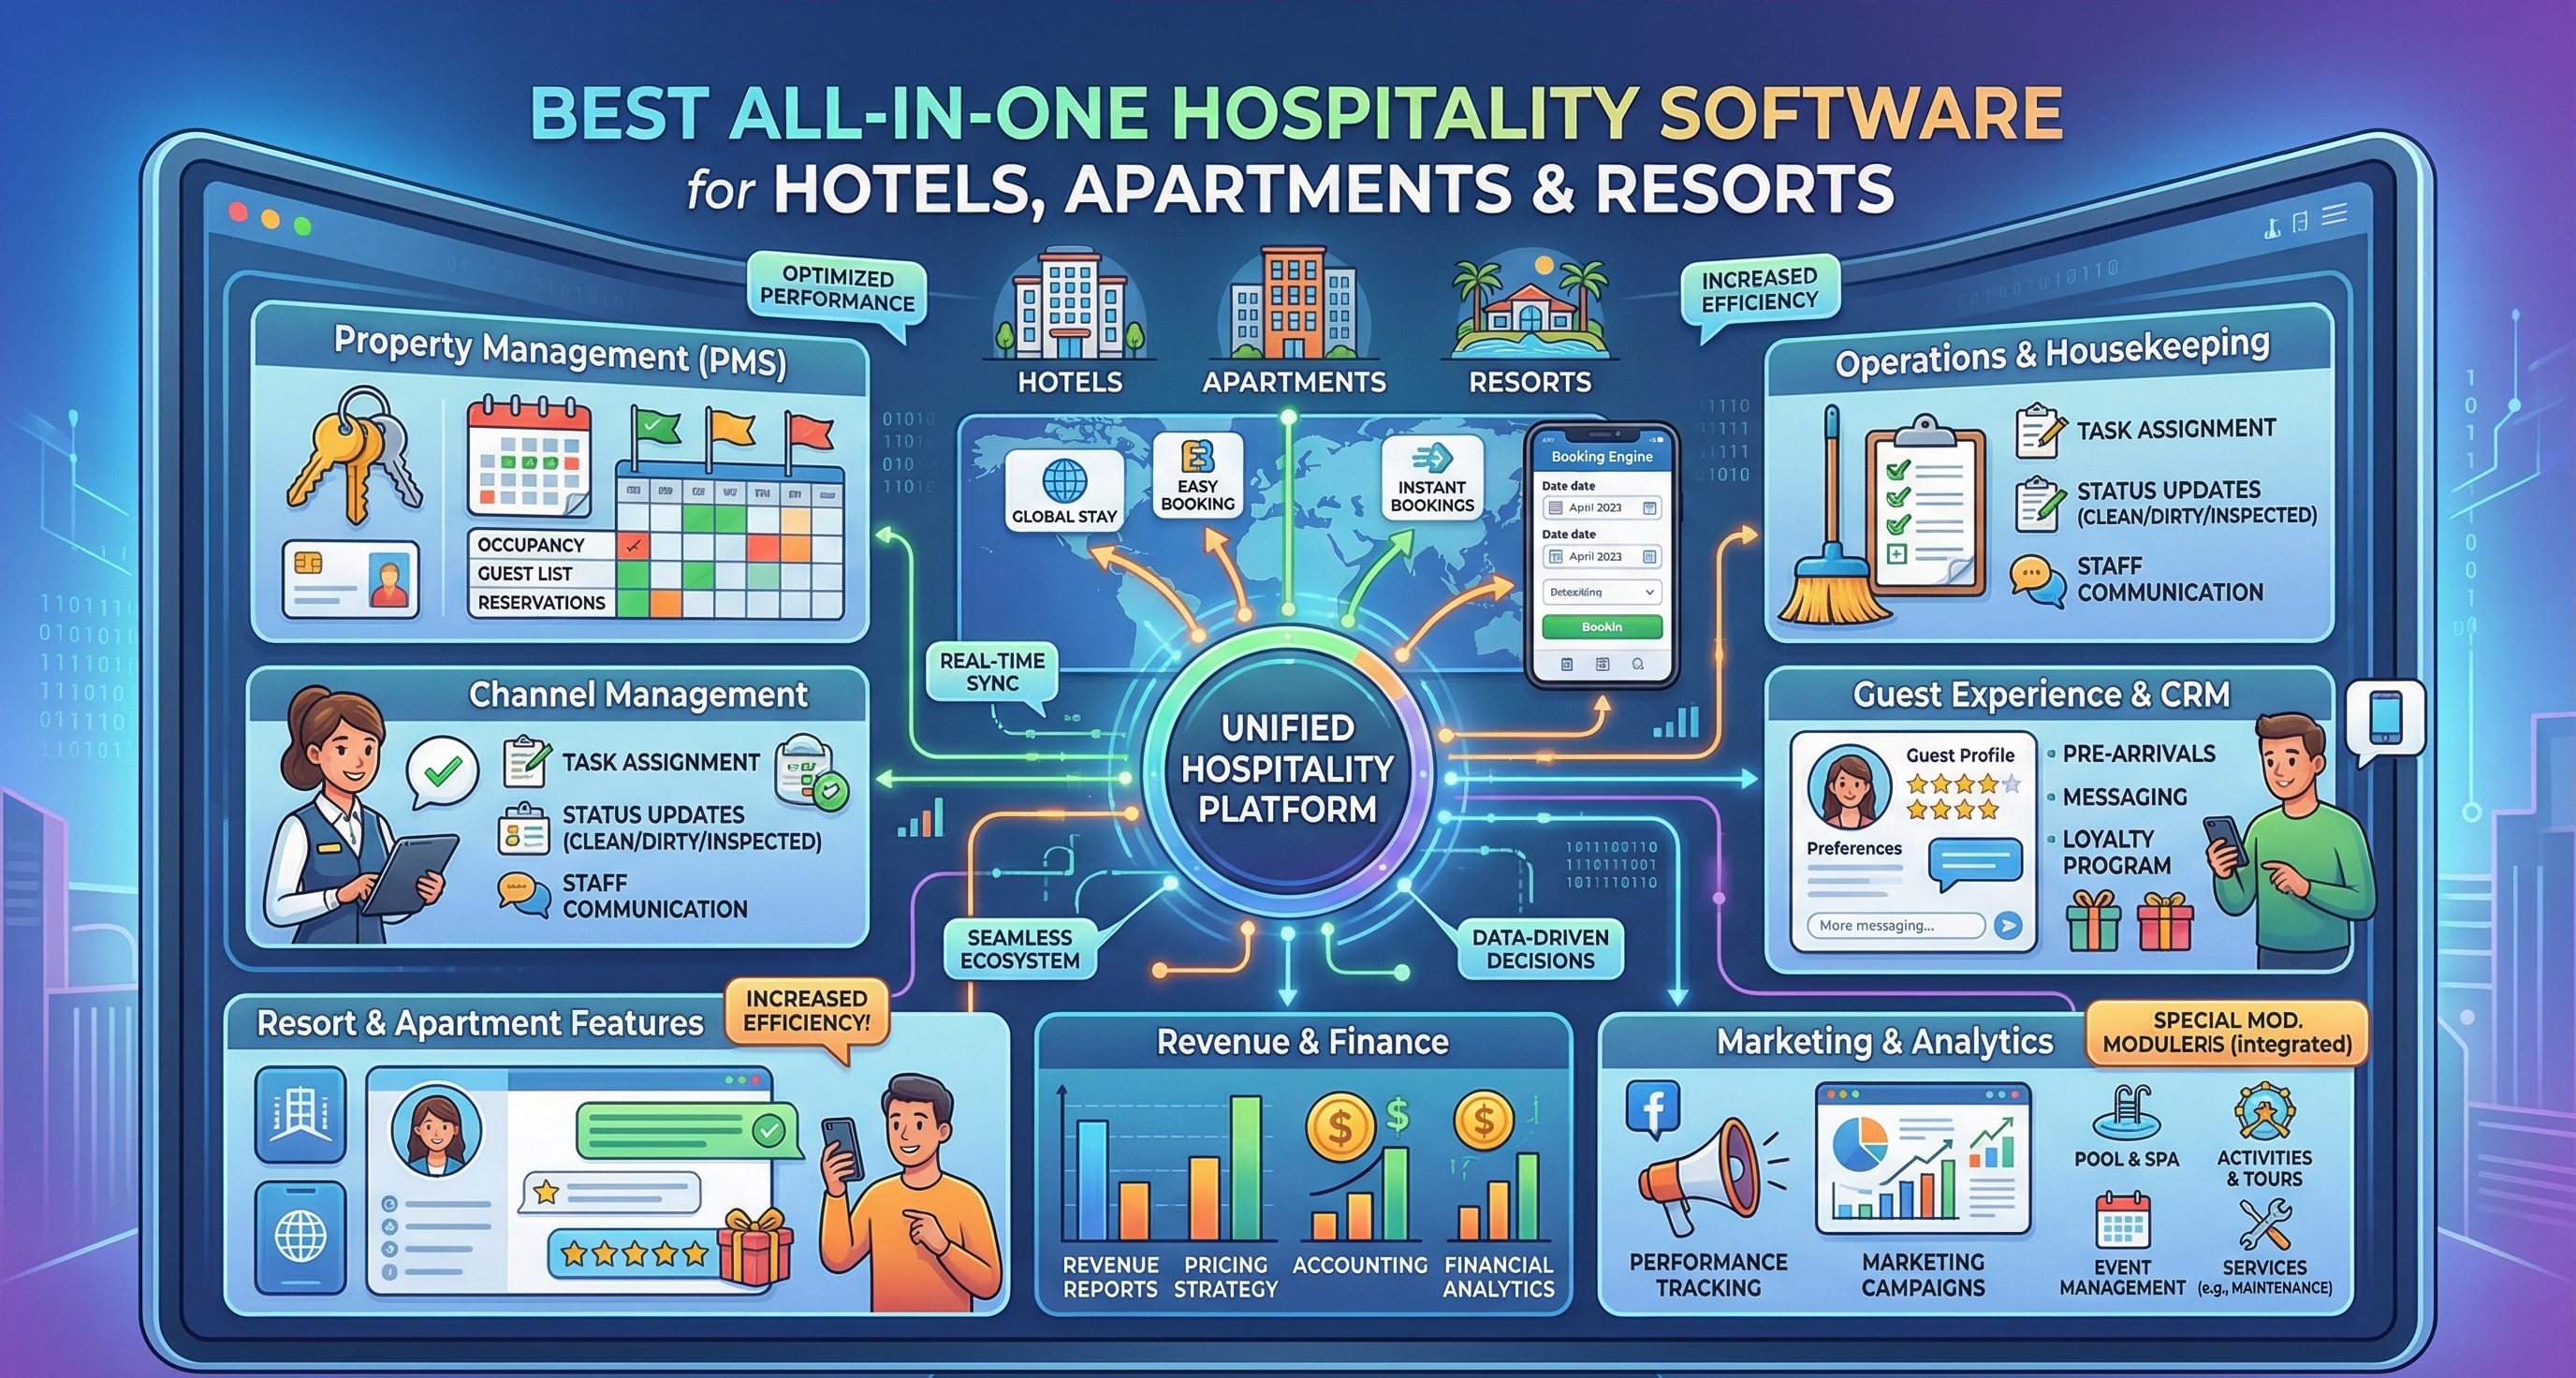
Discover Fandaqah trusted property management software for hotels, apartments & resorts. ZATCA, Shomoos & Tourism compliant. Request your free trial today!...
Fandaqah PMS automates hotel check‑in, ensures ZATCA Phase 2 e‑invoicing & Shomoos integration. 85% faster, trusted by 850+ Saudi properties. Start your free trial....
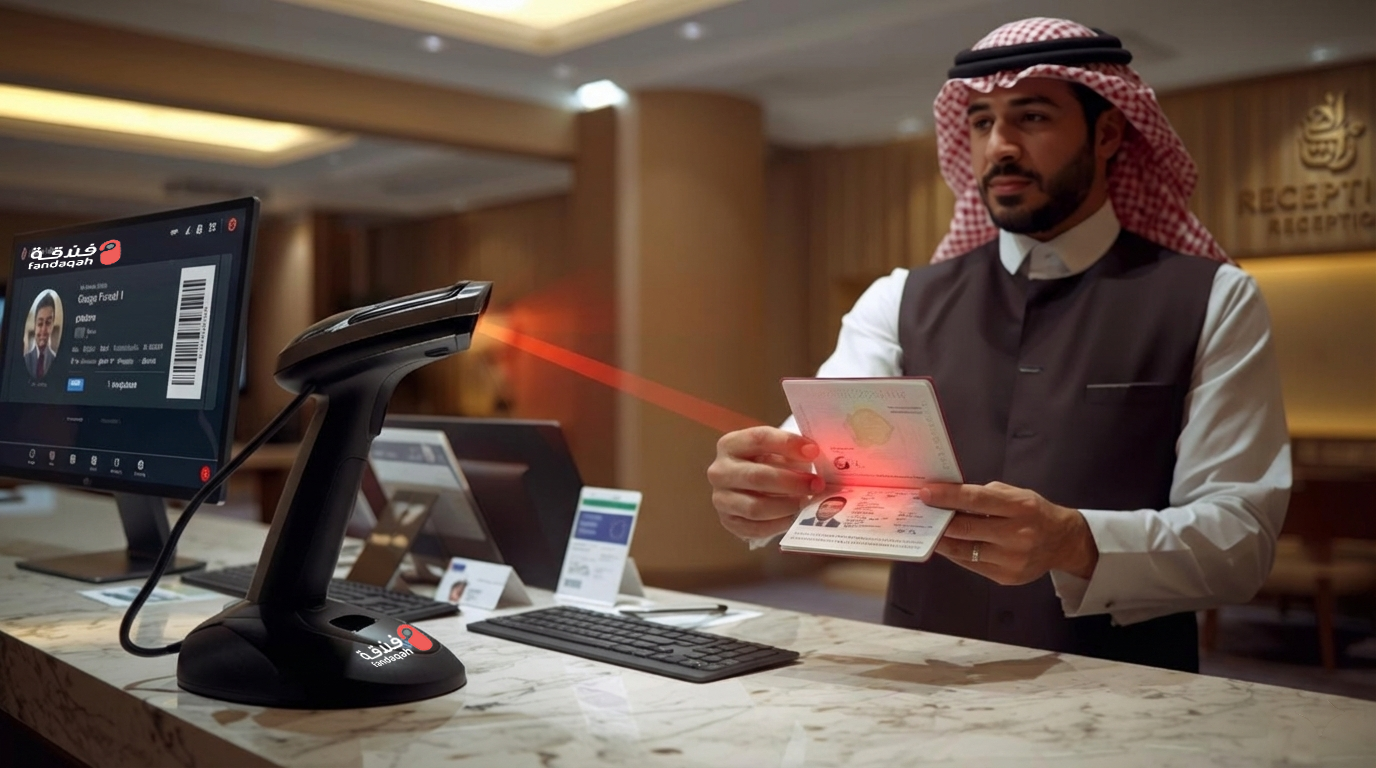
Automate hotel check-in Saudi Arabia with passport scanning. ZATCA compliant, Shomoos integrated. Reduce waiting time 70%. Free demo!...

Join Fandaqah's partner program for hotel management software Saudi Arabia. Earn 200 SAR per referral, ZATCA compliant. 800+ hotels trusted!...
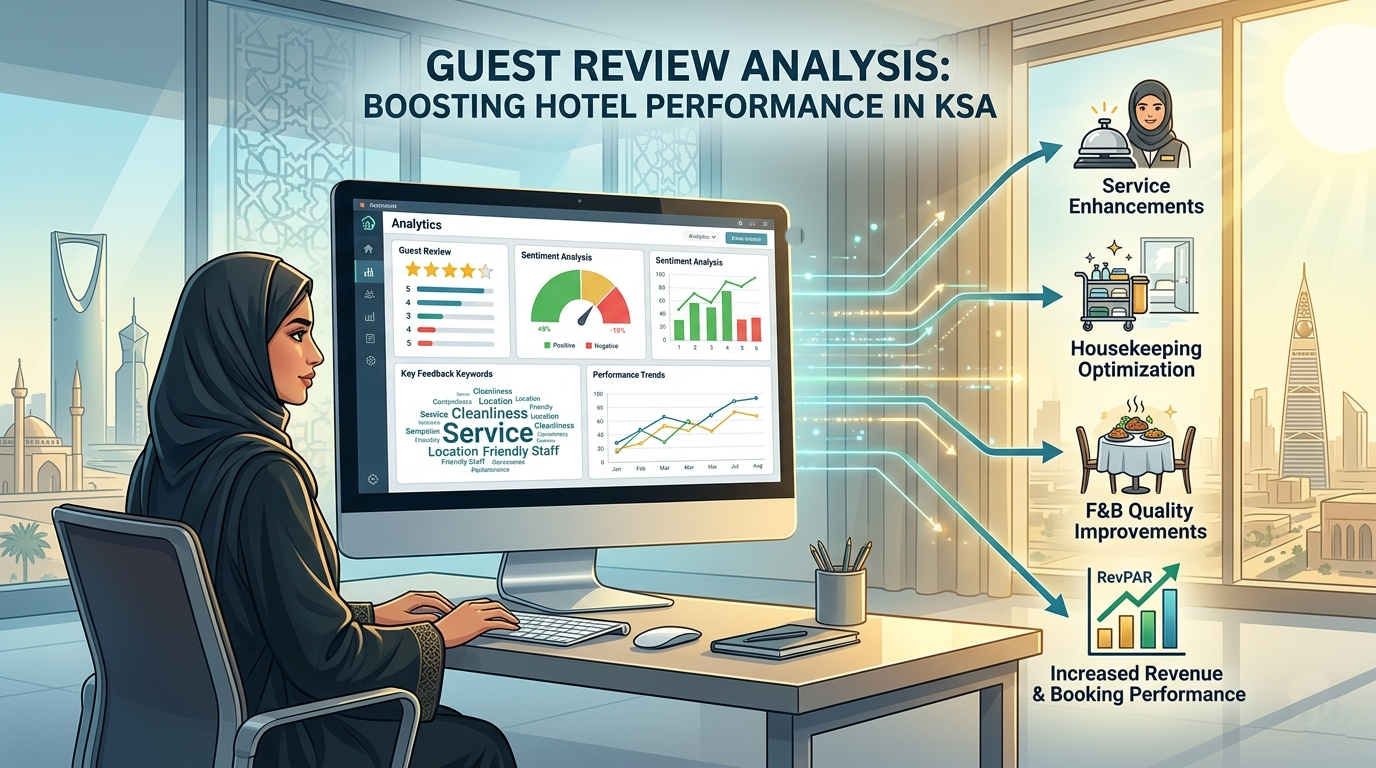
Complete guide to analyzing guest feedback and improving hotel performance in Saudi Arabia. Learn about KPIs, technology, ZATCA & Shomoos compliance, and strategies to increase revenue and guest satis...
Discover how Fandaqah Channel Manager helps Saudi hotels manage and streamline rates across all OTA platforms. Increase direct bookings, automate distribution, ensure ZATCA & Shomoos compliance, and b...
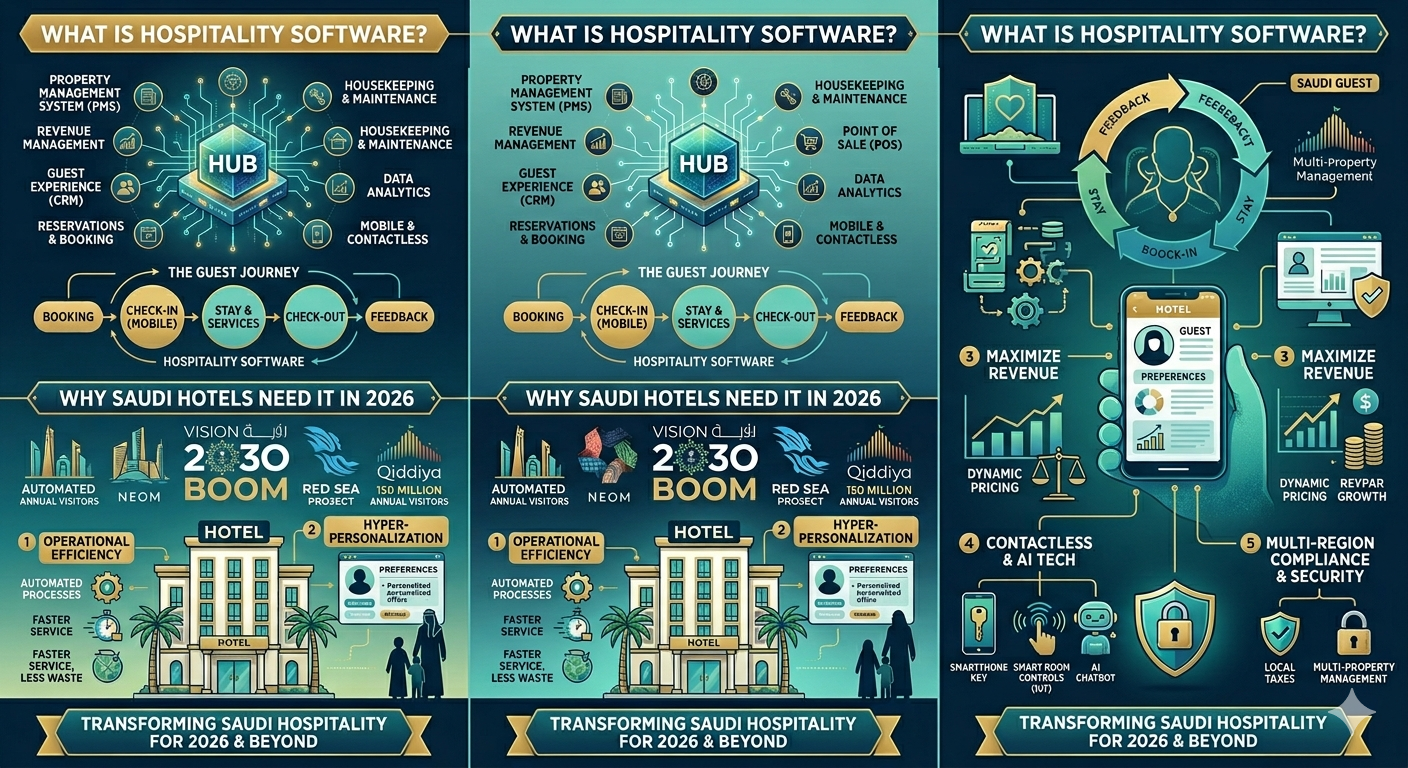
Discover what hospitality software is and why Saudi hotels need it in 2026. Complete guide to hotel management systems, check-in automation, ZATCA & Shomoos compliance, and guaranteed ROI. Fandaqah so...
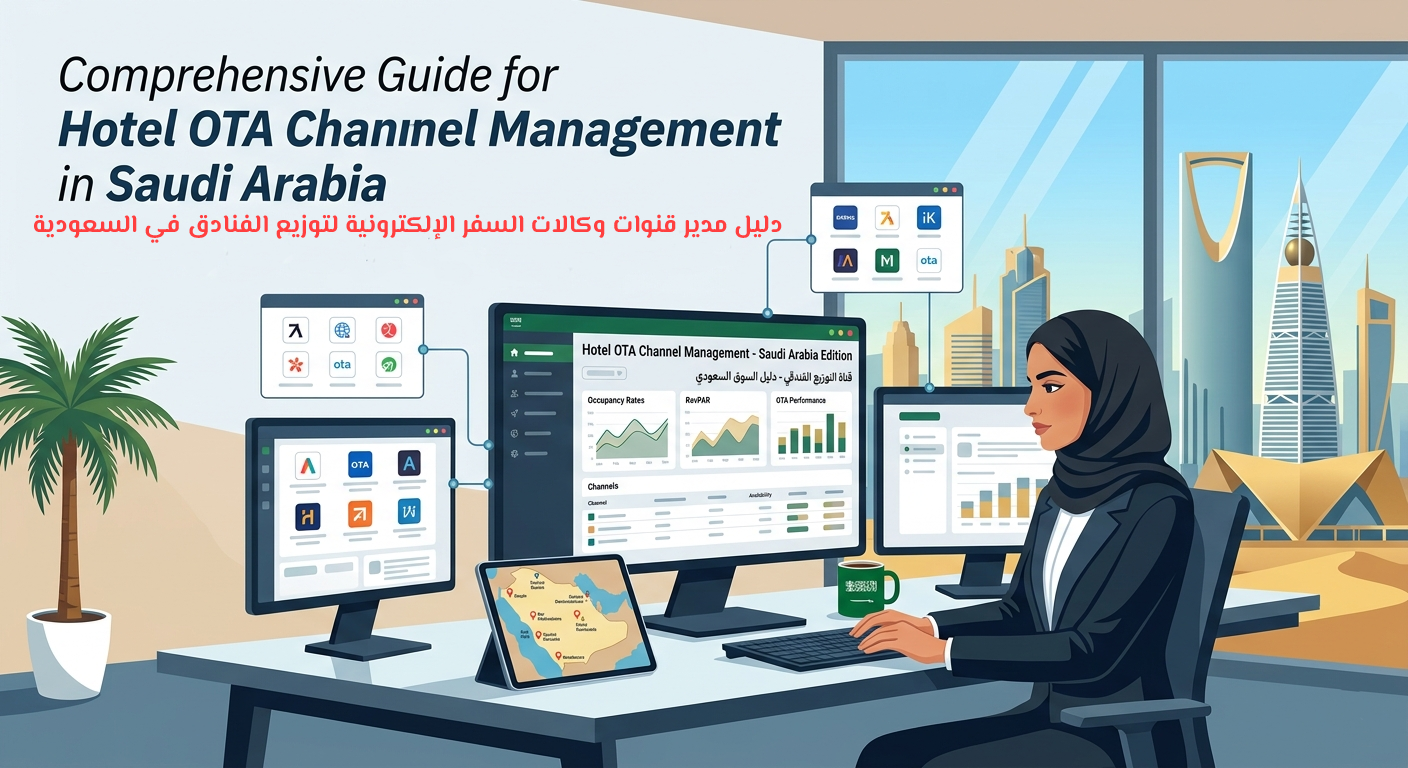
Complete guide to OTA channel manager for hotel distribution in Saudi Arabia. Learn how to increase bookings, automate distribution, comply with ZATCA & Shomoos, and boost revenue. Fandaqah solutions....

Complete hotel audit guide for 2026: learn about night audit procedures, financial reports, compliance with ZATCA & Shomoos, and how automated audits improve accuracy and efficiency for Saudi hotels....
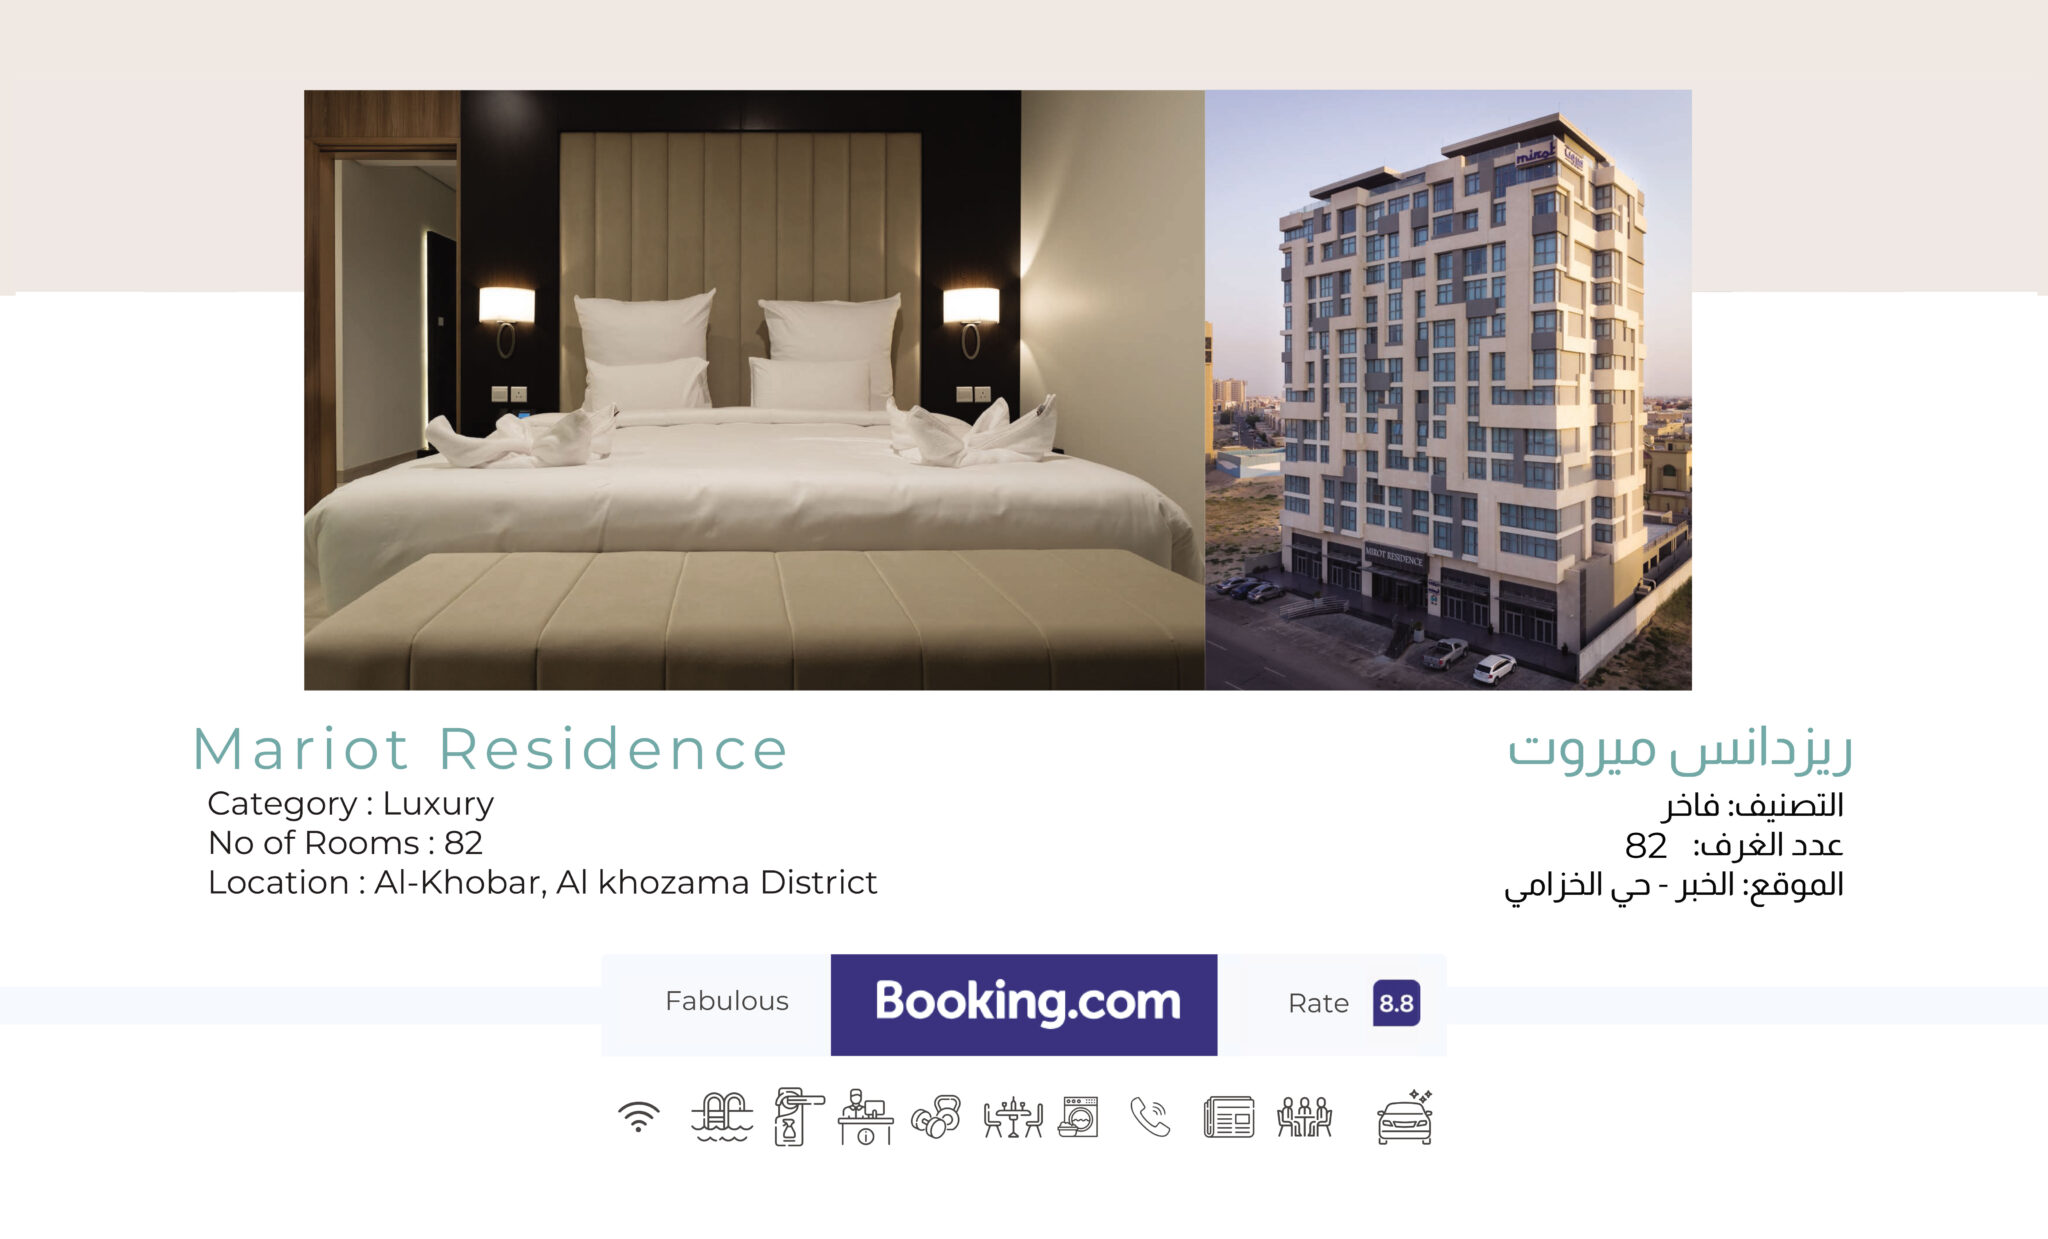
Mariot Residence began as a modest 1-star property with: Limited digital infrastructure Manual operations Basic amenities Difficulty attracting guests and maintaining service quality...

In the hospitality industry, room pricing isn’t just a number on a screen—it’s a strategic decision that directly impacts revenue, occupancy, and guest satisfaction....
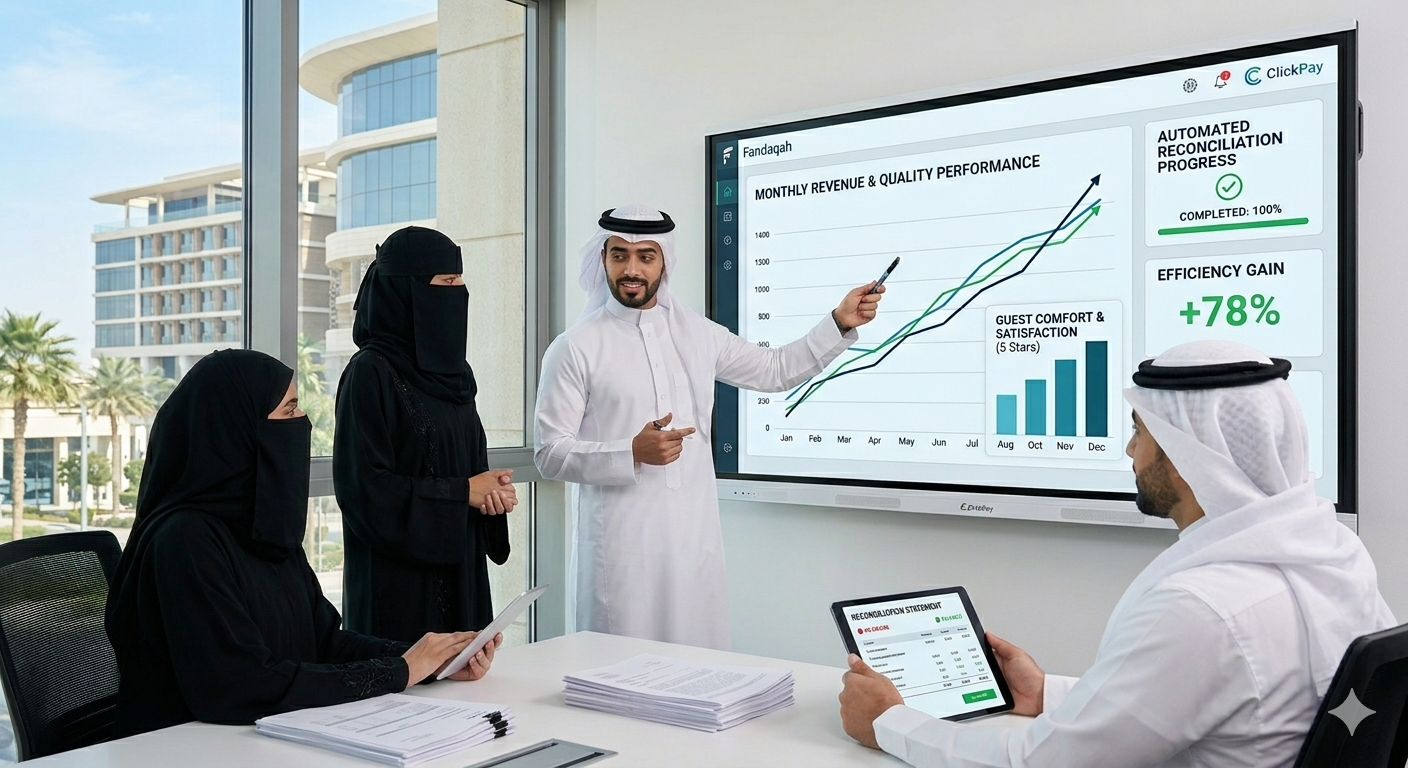
In hospitality, every moment matters. From the first greeting at the front desk to the final checkout, hotels strive to offer a seamless and comfortable experience for every guest. Yet, one aspect oft...
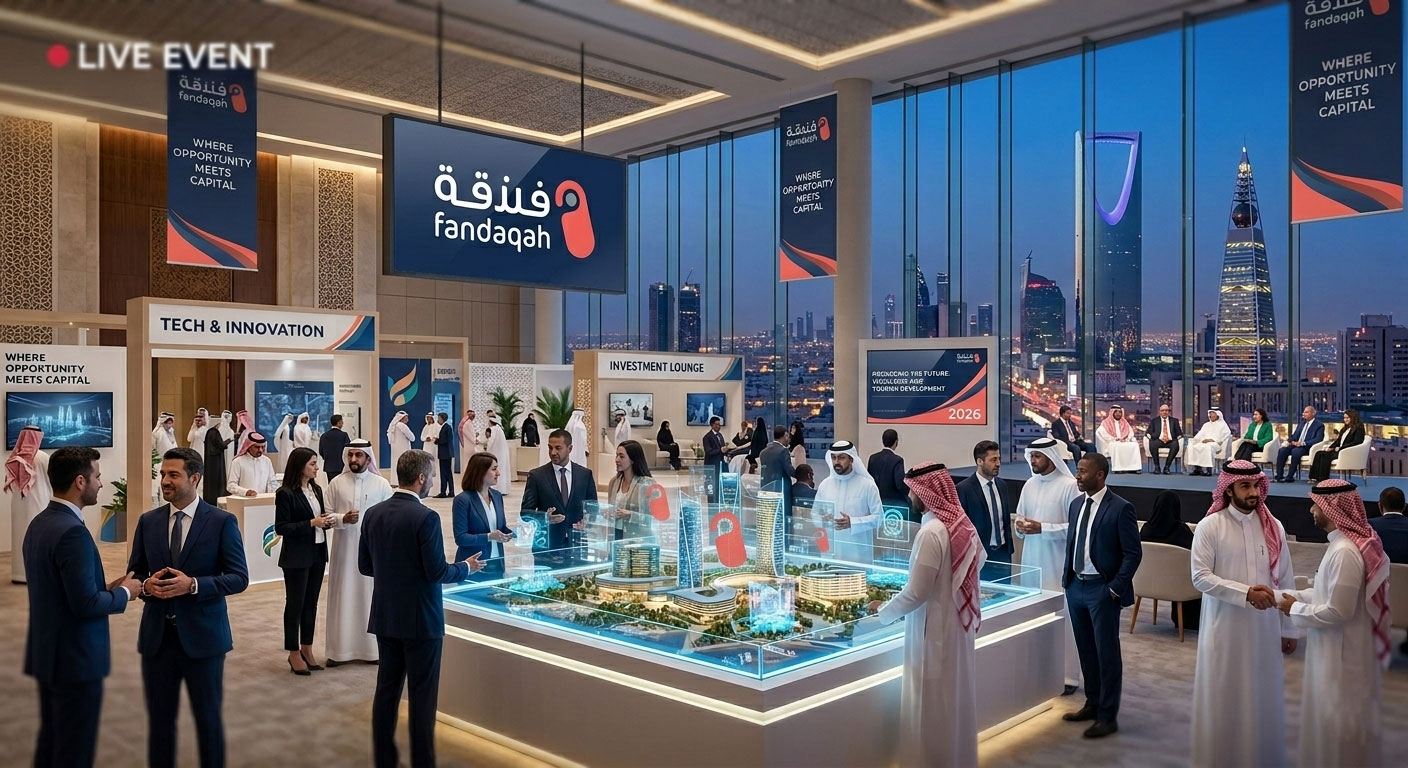
The complete guide to the Saudi Future Hospitality Summit 2026: dates, venue, speakers, investment opportunities, technology, and ZATCA & Shomoos compliance. Join 1,500+ industry leaders in Riyadh....
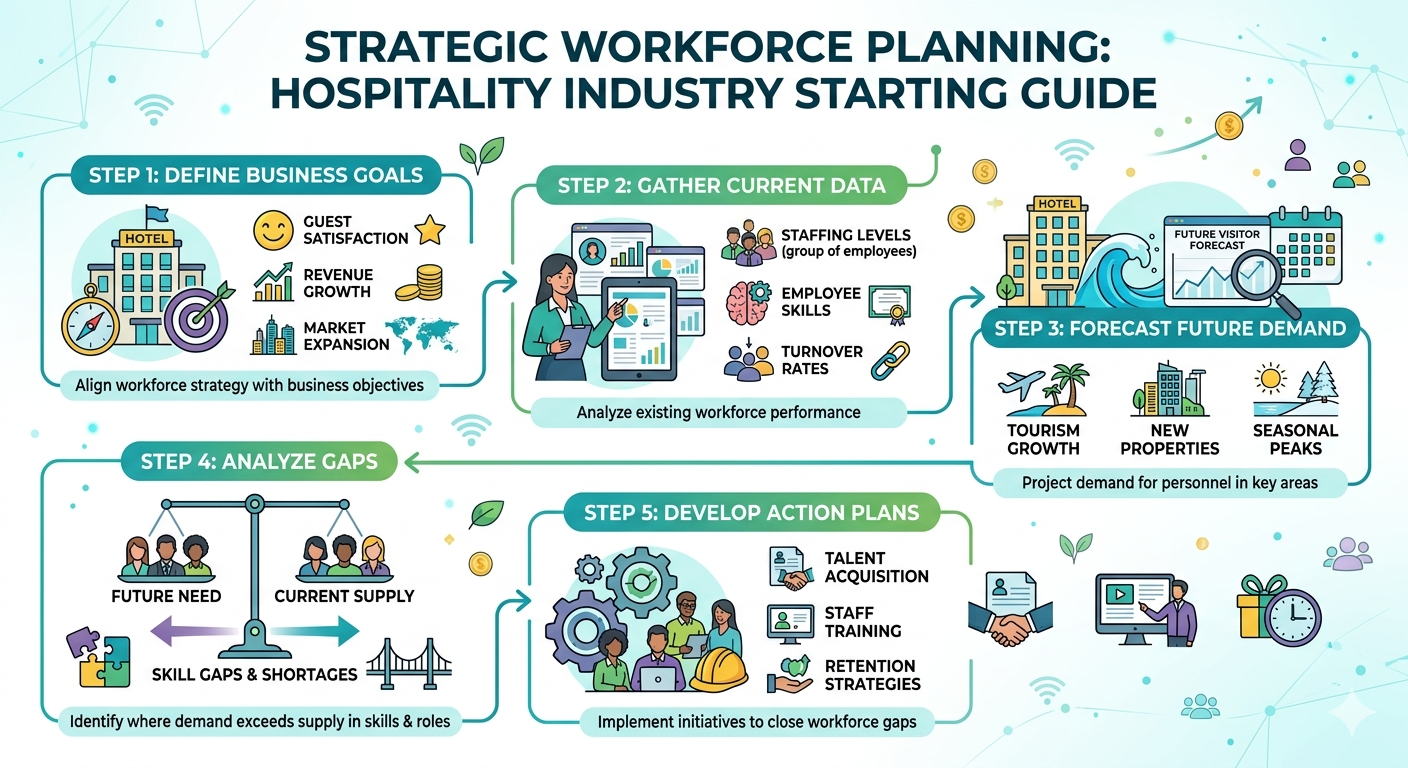
Master strategic workforce planning for Saudi hospitality. Achieve Nitaqat compliance, reduce turnover, and build Vision 2030-ready teams with expert strategies...

In line with Saudi Vision 2030, the tourism sector is undergoing an unprecedented digital transformation. One of the most impactful tools driving this change is the National Tourism Monitoring Platfor...
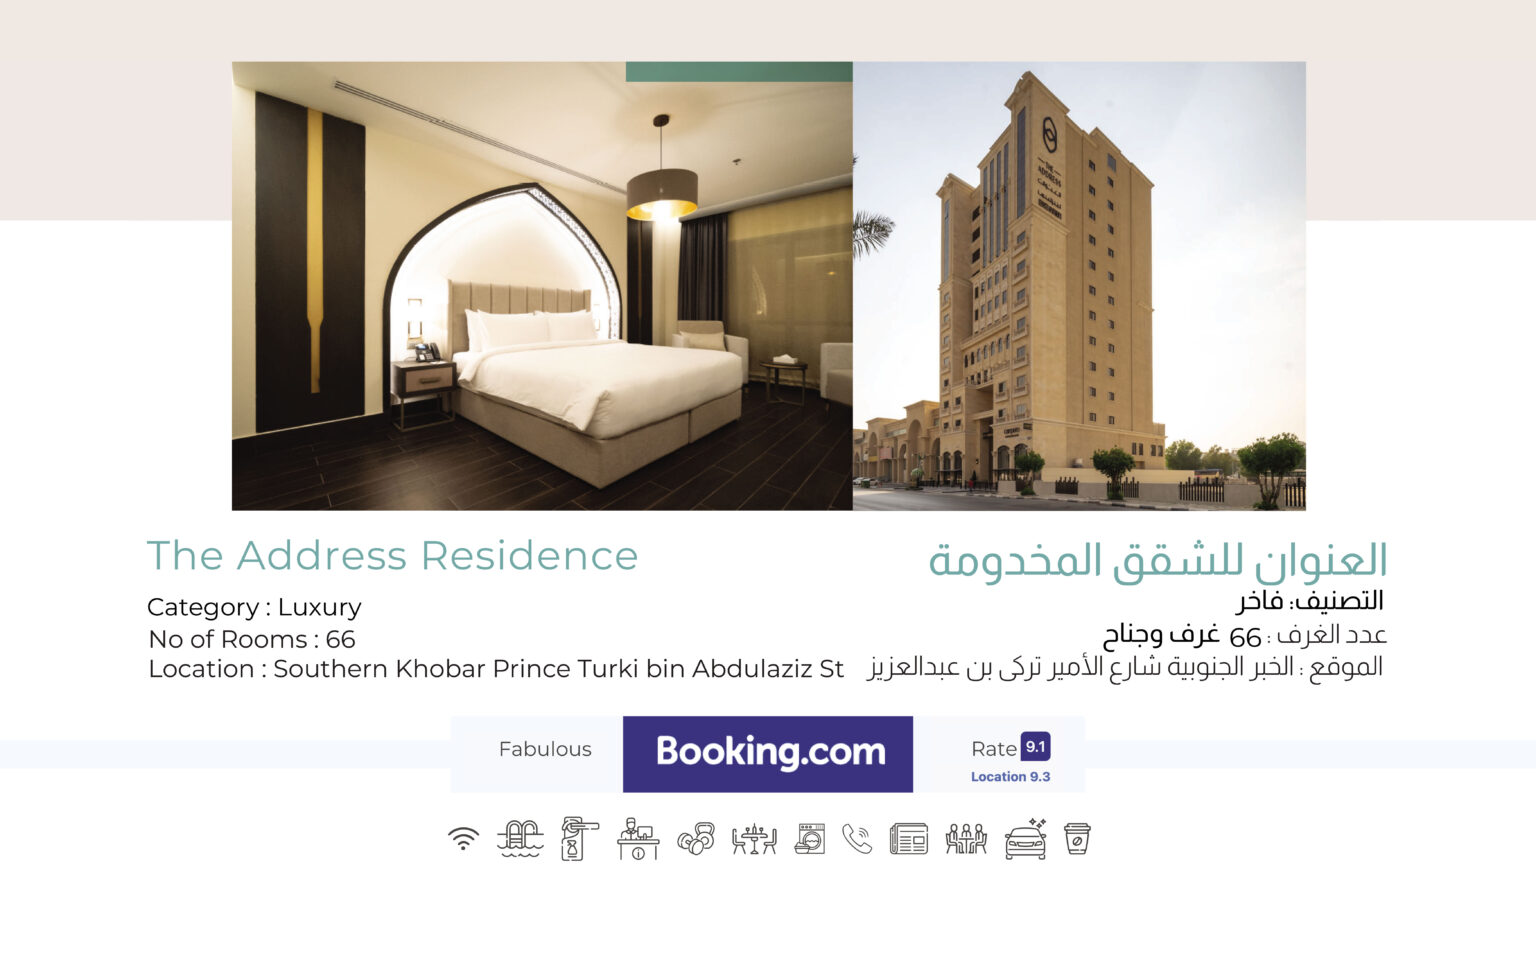
The management adopted Fandaqah PMS, a Saudi-built property management system designed for operational efficiency and government compliance. The result? A complete transformation across operations, gu...

In today’s hospitality landscape, competition is no longer just about location or star ratings. Success now hinges on how effectively a hotel leverages smart technologies to streamline operations an...